

Data profiling tools analyze the structure, content, and relationships in your data to show what is in it, how complete and consistent it is, and where the problems are, before you migrate, integrate, or analyze it. They report things such as data types, null counts, duplicates, value ranges, patterns, and links between tables. The right tool depends on whether you need a quick look at one file, profiling built into your data pipelines, or ongoing monitoring of data quality.
Choosing between the dozens of options is harder than it looks. Some are free libraries for a single dataset, some are features inside data integration platforms, and some are enterprise data quality suites. This guide explains what data profiling tools do, the main categories, how to evaluate them with a practical scorecard and a hands-on test, and how to turn profiling results into data quality rules. It also shows how profiling works in Astera.
What are data profiling tools?
Data profiling is the process of examining data to understand its structure, content, and quality. A data profiling tool automates that work. Instead of scanning rows by hand or writing queries for every column, you point the tool at a file, table, or dataflow and it produces statistics and findings. For a full explanation of the practice, see our guide to data profiling.
The tools generally answer questions such as:
Does the data contain null or blank values, and how many?
Are there duplicate values, and what share of values are unique?
Do values follow the expected format or pattern, such as dates, phone numbers, or postal codes?
Are minimum and maximum values within the expected range?
Do keys match across tables, or are there orphan records?
The three kinds of profiling
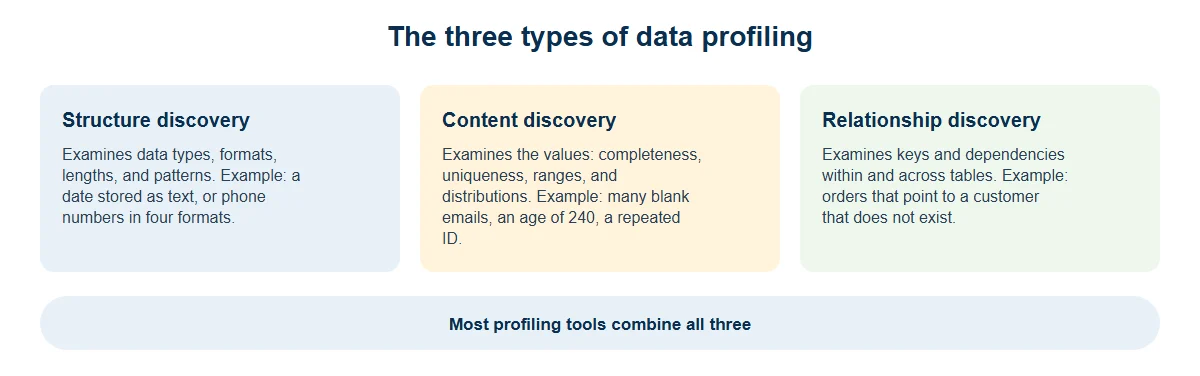
Profiling answers different questions depending on what it looks at. Most tools combine three types of analysis, and it helps to know which one you are using at any moment.
Structure discovery looks at data types, formats, lengths, and patterns. It finds problems such as a date column stored as text, or phone numbers written in four different formats.
Content discovery looks at the values themselves: how complete they are, how unique, and how they are distributed. It finds problems such as many blank emails, an age of 240, or a repeated customer ID.
Relationship discovery looks at the links within and across tables, such as keys, dependencies, and referential integrity. It finds problems such as orders that reference a customer who does not exist.
Features to expect from a data profiling tool
Not every tool offers everything, so use this list as a checklist when you compare options.
Summary statistics give counts, minimum, maximum, mean, and spread for each field. They are a fast first read of the data.
Null and blank counts show how complete each column is. Missing values break joins and reports.
Duplicates and uniqueness show how many values repeat and the ratio of unique values. They help find duplicate records and weak keys.
Data types and patterns show whether values follow expected formats, which catches mixed formats and wrong types.
Value distributions show how often each value appears. They reveal inconsistent labels such as "USA" and "United States".
Outliers and ranges flag values outside the expected range, which surfaces errors and unusual events.
Cross-column and cross-table analysis reveals dependencies and key relationships, and finds orphan records and broken references.
Data quality rules check data against your own conditions, which turns one-time findings into repeatable checks.
Scheduling and automation let profiling run on its own, so you can track quality over time.
Reporting and export let you share and store results for review and audit.
Perform Effortless Data Profiling with Astera
Astera's robust, enterprise-grade data integration can not only handle data profiling but take care of your end-to-end data pipelines.

Data profiling tools use cases
Profiling pays off most at the moments when data changes hands.
Data migration. Before moving data between systems, profiling reveals discrepancies so they can be fixed before they reach the new system. See our guide to data migration tools.
Data integration. When combining data from several sources, profiling confirms the sources fit together and catches errors before they load into a data warehouse, data hub, or data mart. See data integration and what a data warehouse is.
Data cleansing. Cleansing helps only when you know what is wrong. Profiling finds the problems, such as incorrect fields, null values, and statistical irregularities, that cleansing then fixes. See data cleansing.
Analytics and AI readiness. Before building reports or models, profiling shows whether the data is complete and consistent enough to trust.
Ongoing quality monitoring. Scheduled profiling shows whether quality is improving or slipping over time.
Categories of data profiling tools
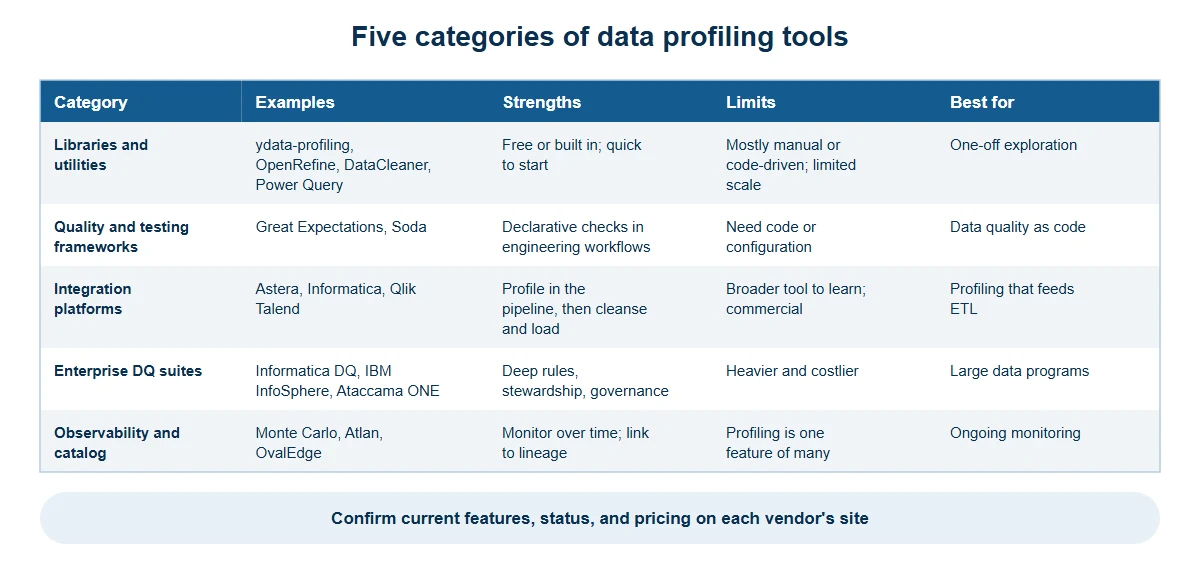
A long list of vendors can make the choice harder, because many of these tools do quite different jobs. It is more useful to start with the kind of tool you need. The five categories below are each described by what they are good at and where they fall short.
1. Free libraries and utilities
If you want to understand one file or one table, start here. These tools are free or already built into software you use, and they can give you a profile of a dataset in minutes. Examples include ydata-profiling for Python, OpenRefine, DataCleaner, and the column profiling in Microsoft Power Query.
The trade-off is scale and repeatability. Most are used by hand or through code, so scheduling, alerts, and very large volumes take extra work. They are best for one-off exploration by an analyst or data scientist.
2. Data quality and testing frameworks
Teams that treat data quality like software testing tend to choose these. With Great Expectations or Soda, you write checks, such as "this column must never be empty", and run them automatically in your pipelines. Profiling helps you decide what to check, but the main purpose is testing.
They need code or configuration, so they work best for data engineering teams that already work that way.
3. Integration platforms with built-in profiling
In this category, profiling is one step in a larger flow. You profile the data, fix what you find, then transform and load it, all in the same environment. Astera, Informatica, and Qlik Talend are examples.
These are broader tools, so there is more to learn, and they use commercial licensing. They are best for migration, integration, and data warehouse projects, where findings should feed straight into cleansing and loading.
4. Enterprise data quality suites
Large organizations with dedicated data teams often choose a full data quality suite. Informatica Data Quality, IBM Infosphere Information Analyzer, and Ataccama ONE are examples. They offer deep rule libraries, data stewardship, and governance features.
That depth comes with heavier deployment and higher cost. They are best for enterprise-wide data quality programs with people to run them.
5. Observability and catalog tools
These tools watch the health of your data over time and connect it to lineage and ownership. Monte Carlo, Atlan, and OvalEdge are examples. Profiling is one feature among many, so they are not the first choice for a deep, one-time look at a dataset.
They are best for ongoing monitoring across a modern data stack, when you want to catch problems soon after they appear.
Before you trust a roundup
Whichever category you lean toward, check a few things before you rely on any list, including this one:
Maintenance. Open-source tools differ in how actively they are maintained, so look at recent release activity before you commit.
Retired tools. Talend Open Studio, once a popular free option, was retired by Qlik on January 31, 2024, and no longer receives updates. See the cimt overview of the Talend Open Studio end of life
Changing details. Product names, editions, and prices change often, so confirm current details on each vendor's site.
How to choose a data profiling tool
The best tool for you depends less on a long feature list and more on the job you need it to do. A simple three-step approach keeps the decision grounded: decide what you need the tool for, score a short list of candidates against the criteria that matter, and then test each one on data you know is flawed.
Step 1: Start with the job to be done
Before you compare products, work out which situation you are in. It narrows the field quickly.
A one-off look at a single file or table. A free library or a built-in profiler is usually enough.
Profiling inside your data pipelines, with rules and a schedule. Look at an integration platform that can profile, cleanse, and load in one place.
Ongoing monitoring of data health across many systems. A dedicated data quality or observability tool is a better fit.
Step 2: Score your shortlist
Once you have two or three candidates, compare them on the same criteria. Score each tool from 1 to 5 on every row, and give extra weight to the rows marked high priority, because gaps there are the hardest to work around later. The questions in the second column are ones you can put directly to a vendor or answer during a trial.
Criterion | Question to ask | What a good answer looks like | Priority |
Source coverage | Can it connect to every source and format we use? | Native connectors for your databases, files, APIs, and cloud stores | High |
Profiling depth | Does it cover structure, content, and relationships? | Statistics, patterns, distributions, uniqueness, and cross-table checks | High |
From findings to rules | Can we turn a finding into a repeatable rule? | Rules with error and warning levels, and clear messages | High |
Automation | Can profiling run on a schedule? | Scheduling and alerting without manual steps | High |
Ease of use | Can analysts use it without code? | A visual interface, with code optional | Medium |
Scale and performance | Does it handle our volumes? | Profiling in place or in the pipeline, not only on small samples | Medium |
Pipeline fit | Does it connect to cleansing and ETL? | Profile, cleanse, transform, and load in one environment | Medium |
Cost, support, and maintenance | What does it cost to run and keep current? | Transparent licensing, active support, and regular updates | Medium |
Step 3: Test each tool on the same messy file
Vendor demos use clean data, which shows you very little. A better test is to build one small file with problems you already know about, and run every shortlisted tool against it. Because you know what is in the file, you can see right away what each tool catches and what it misses.
Plant defects like these, and check what each tool reports:
Blank values in a required column. The tool should show a null or blank count for that column.
A repeated customer ID. It should report a duplicate count and a uniqueness ratio below 100 percent.
Dates in two or more formats. It should flag mixed patterns or format variations.
One impossible value, such as an age of 240. It should show a maximum value outside the expected range.
"USA", "U.S.A.", and "United States" in one column. Its value distribution should expose the variants.
An order for a customer who is not in the customer table. It should report a relationship or referential integrity problem.
A number stored as text. It should report a data type mismatch.
When the results are in, ask three practical questions. How many defects did the tool find without any configuration? How easy was it to turn a finding into a rule? Could you schedule the same check to run again? A tool that finds everything once but cannot repeat the check will not help you keep the data clean over time.
From profiling to data quality rules
Profiling tells you what is wrong today. Rules keep it from going wrong again. A simple loop works well:
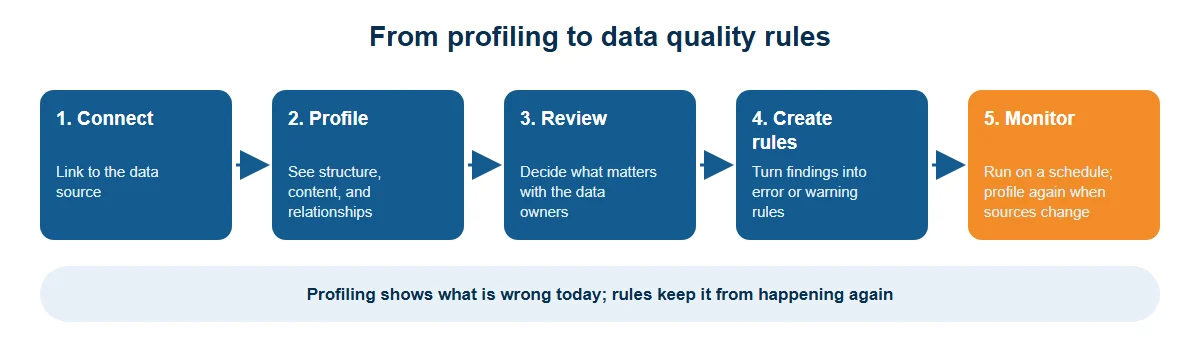
1. Connect to the data source.
2. Profile the data to see its structure, content, and relationships.
3. Review the findings with the people who own the data, and decide what matters.
4. Create rules for the conditions you care about.
5. Monitor by running the rules on a schedule, and profile again when sources change.
Here is how typical findings turn into rules (examples are illustrative):
Customer email is blank in some records. Add a rule that email must not be empty. Treat it as a warning, or as an error if email is required downstream.
Duplicate order IDs. Add a rule that order ID must be unique. Treat it as an error, so the record does not load.
Mixed date formats. Add a rule that the date must match the agreed format. Treat it as an error until the source is fixed, or standardize the dates in the pipeline.
Unit price outside a plausible range. Add a rule that price must fall between agreed limits. Treat it as a warning for review.
Country values with many variants. Add a rule that country must be in the approved list. Standardize first, then treat anything unmatched as an error.
For the standardization step, see our guide to data standardization. For ways to measure the results, see data quality metrics and the data quality framework.
Data profiling in ETL and data pipelines
Profiling is most valuable when it sits inside the pipeline instead of beside it. In an ETL or ELT flow, profile at three points:
At extraction, to understand the source before you design transformations.
After transformation, to confirm the data now meets your rules.
Before loading, to stop bad records from reaching the warehouse or application.
When profiling is part of the pipeline, the results are repeatable, and the same flow can run profiling every time new data arrives. See our guides to ETL, data pipelines, and ETL testing.
Data profiling with Astera
Astera brings data profiling, data quality rules, cleansing, and integration into one no-code environment, with a drag-and-drop interface that business users can work in, in Astera Data Stack. These are the capabilities most relevant to profiling.
Data Profile produces statistics for each selected field when the dataflow runs, including data type, minimum and maximum values, data count, and error count. It can also report details such as blank counts and duplicates, and the results can be written to a destination for review.
Data Quality Mode is an option for advanced profiling and debugging. When a dataflow is opened in this mode, most objects show a Messages node that captures status information and error messages as records move through the pipeline.
Data Quality Rules apply one or more conditions to incoming records, using expressions you write or build with an expression builder. You can mark a rule as an error, which excludes failing records from downstream processing, or as a warning, which lets them continue. Each rule can carry a message that explains why a record was flagged.
Data Cleanse removes whitespace, tabs, line breaks, letters, digits, and punctuation, replaces nulls, and supports find and replace and case changes, so you can fix what profiling finds.
Data Prep data health gives an interactive view of overall data health and per-column profiles in Astera Data Prep, with a no-code interface for transformations.
Data lineage shows where data originated and the transformations it passed through.
Automation and scheduling let you run profiling and quality checks on a schedule as part of an automated flow.
A walkthrough in outline: profile, flag, and fix
Here is how the capabilities above fit together in a typical flow, from reading the source to loading clean data.
1. Build or open a dataflow that reads your source, such as a database table or a file.
2. Add the Data Profile object and select the fields to profile.
3. Run the dataflow and review the statistics for each field, such as data type, minimum and maximum values, counts, and errors.
4. Add Data Quality Rules for what you found, choosing error or warning for each.
5. Write the failing records to an error log or destination so they can be reviewed.
6. Fix the data with Data Cleanse and other transformations, then load it to its destination.
7. Schedule the flow so the checks run every time new data arrives.
To see how the pieces fit, read our guides to data cleansing tools, data quality tools, and data quality management. For standardizing values after profiling, see our walkthrough of data standardization in Astera Data Prep.
Ready to profile your own data? Start a free 14-day trial or talk to our team.
Common mistakes when choosing and using data profiling tools
Most problems with profiling come from how teams choose and use the tools, not from the tools themselves. These are the mistakes to watch for.
Choosing by a feature list instead of the job. A tool with 50 features may still be the wrong one for a one-off file or for a pipeline.
Profiling a sample and trusting it. Defects in rare records can hide in samples. Profile full data where you can.
Treating profiling as a one-time event. Sources change. Schedule it.
Stopping at findings. A report that no one acts on does not improve quality. Turn findings into rules.
Skipping the data owners. The people who know the data can tell you which findings are real errors and which are legitimate.
Trusting an outdated roundup. Tools are retired, renamed, and repriced, so check each vendor's current status.
Final word
The best data profiling tool is the one that fits your job. A free library is enough for a quick look at a file. A platform that profiles inside your pipelines is a better fit when profiling must feed cleansing, rules, and loads. Whatever you choose, test it on a file with known defects, insist on a path from findings to rules, and make profiling a routine, not a project. If you want profiling, rules, cleansing, and integration in one no-code environment, Astera is built for that.
Related reading: What is data profiling? · What is data quality? · Data integrity in a database · What is data observability? · Data lineage · Data management software