

Marketing data analytics is the process of collecting, analyzing, and interpreting data from your marketing activities, such as website traffic, email campaigns, social media, and advertising, to guide smarter decisions. It turns campaign numbers into answers: which channels deliver the best return, which audiences respond, and where to invest next.
Marketing teams have more data than ever, spread across many tools. The teams that get the most from it combine three things: the right metrics, a clear view of their data sources, and a reliable way to bring that data together. This guide walks through each one, with formulas and examples you can use right away.
What is marketing data analytics, and why does it matter?
Marketing data analytics covers the collection, analysis, and interpretation of data from marketing initiatives. That includes website traffic, social media engagement, email campaign results, paid advertising, and customer records from your CRM.
Done well, it helps you:
Make data-driven decisions. Base strategy and budget on what the numbers show.
Refine targeting. Learn which audiences and messages respond best.
Allocate resources efficiently. Put budget behind the channels and campaigns that perform.
Increase campaign impact. Test, learn, and improve each campaign over time.
It also makes it easier to explain marketing's contribution to the wider business, because results are measured in the same terms finance and leadership use.
This guide focuses on the metrics and data behind marketing analytics. For the strategic approach and use cases such as lead scoring and attribution, see our guide to data-driven marketing. For the broader discipline, see our guide to data analytics.
Types of marketing analytics
Marketing analytics is commonly grouped into four types. Each builds on the one before it.
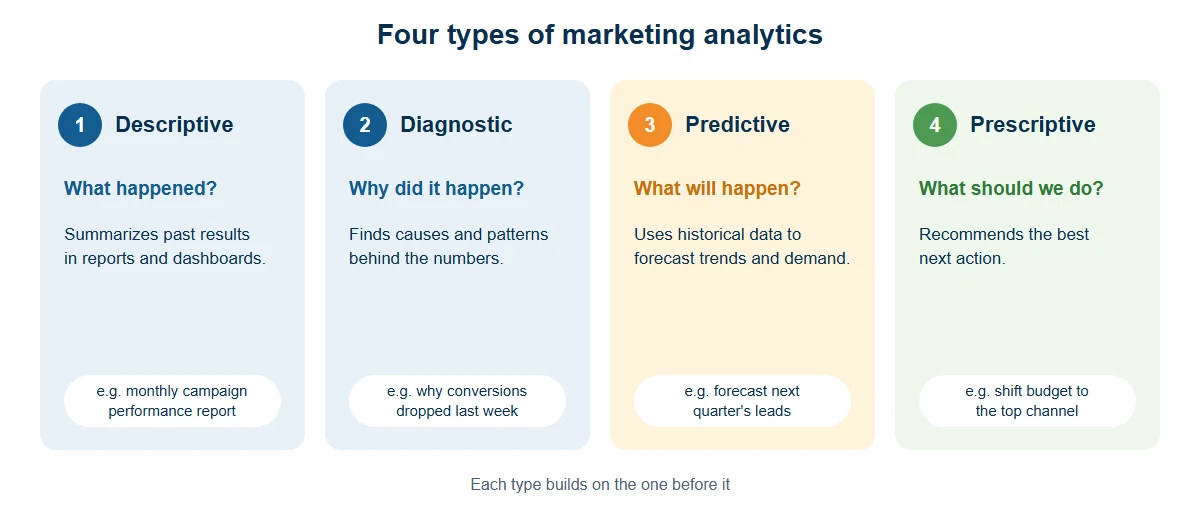
The four types of marketing analytics.
Type | Question it answers | Marketing example |
|---|---|---|
Descriptive | What happened? | A monthly report on campaign reach, clicks, and conversions |
Diagnostic | Why did it happen? | Finding why conversions rose or fell after a change to a landing page |
Predictive | What is likely to happen? | Forecasting next quarter's leads from historical data |
Prescriptive | What should we do? | Recommending a budget shift toward the best-performing channel |
Most teams start with descriptive reporting and grow into diagnostic and predictive analysis as their data becomes more complete. AI-assisted tools are making the later stages more accessible. Learn more in our guide to AI data analysis.
Where marketing data comes from
A complete view of performance draws on several sources:
Website and app analytics: visits, sources, pages viewed, and conversions.
CRM: contacts, leads, opportunities, and customer history.
Email and marketing automation: sends, opens, clicks, and unsubscribes.
Social media and advertising platforms: impressions, engagement, clicks, and spend.
E-commerce and point-of-sale systems: orders, baskets, returns, and repeat purchases.
ERP and finance systems: costs, revenue, and margins.
Surveys and feedback: satisfaction scores and customer comments.
Each source uses its own definitions and formats. Bringing them together is what lets you compare channels fairly and follow a customer from first click to repeat purchase. We cover how to do that in the data integration section below.
How to use data analytics to maximize marketing ROI
Understand customer behavior
Tracking website interactions, click-through rates, and customer journeys shows how people move from interest to purchase. For example, analyzing clicks by product category can show which items deserve more prominent placement, which can lift conversions.
Personalize campaigns
Analytics helps you move beyond one-size-fits-all messaging. By segmenting audiences by demographics, interests, and past behavior, you can tailor messages and offers to each group. Recommendation engines are a well-known example of this approach at scale.
Plan with predictive analytics
Historical data helps forecast trends, plan inventory, and set budgets. Predicting demand ahead of a season lets you prepare campaigns and stock levels in advance.
Optimize ad spend
Comparing channels side by side shows where each dollar works hardest. For instance, comparing results from Instagram and Facebook, along with audience demographics and content formats, can guide where to put the next budget increase.
Monitor campaigns in real time
Near real-time dashboards let you see how campaigns perform as they run, so you can move budget to the best-performing ad variants and refresh creative that is underperforming.
Key marketing data analytics metrics
The metrics below cover the most common questions marketing teams ask. Each has a formula and a worked example. The examples are illustrative.
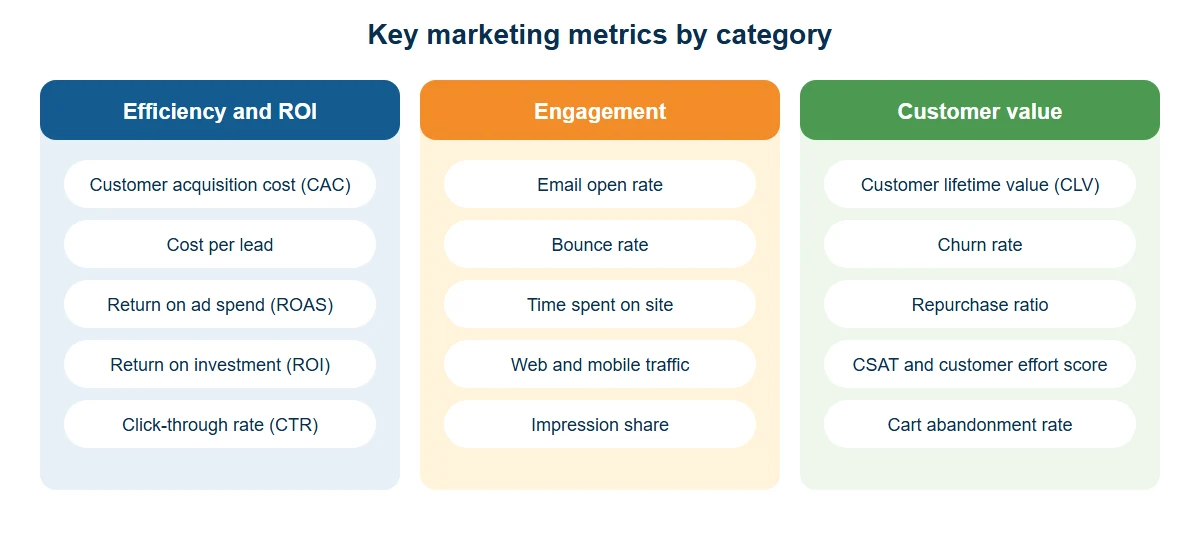
Efficiency and ROI
Metric | How to calculate it | Example |
|---|---|---|
Customer acquisition cost (CAC) | Total acquisition spend ÷ new customers | $800 spent to acquire 40 customers = $20 CAC |
Cost per lead | Spend ÷ leads generated | $600 spent for 12 leads = $50 per lead |
Return on ad spend (ROAS) | Revenue from ads ÷ ad spend | $2,400 revenue from $1,200 spend = 2.0 |
Return on investment (ROI) | (Profit ÷ cost) × 100 | $600 profit on $1,200 spent = 50% |
Click-through rate (CTR) | Clicks ÷ impressions × 100 | 24 clicks from 1,200 impressions = 2% |
Engagement and reach
Metric | How to calculate it | Example |
|---|---|---|
Email open rate | Emails opened ÷ emails delivered × 100 | 3,600 of 6,000 opened = 60% |
Bounce rate | Visitors who leave without engaging ÷ total visitors × 100 | 720 of 1,800 leave = 40% |
Time spent on site | Average session duration | An average of 15 seconds suggests the content needs a closer look |
Impression share | Impressions received ÷ impressions available × 100 | 4,800 of 10,000 possible impressions = 48% |
Brand mentions | Count of mentions across social media, news, and reviews | Tracked over time to see awareness trends |
Email open rates can be affected by email privacy features, so pair them with clicks and conversions for a fuller picture.
Website metrics worth tracking alongside these include web traffic (volume and sources), mobile traffic (device-based access), screen flow (the paths users take), unique visitors, and referral traffic (where visits come from).
Customer value and satisfaction
Metric | Description | Example |
Customer lifetime value (CLV) | Measure the total value a customer is expected to bring over their relationship. | The customer purchases $120 products 4 times a year for 2 years, CLV = $960. |
Customer Acquisition Cost (CAC) | Calculate the cost of acquiring a new customer. | $800 spent on marketing, acquiring 40 customers, CAC = $20. |
Churn Rate | Measure the rate at which customers stop doing business. | Start with 2500 customers, lose 1250 in a month, Churn Rate = 50%. |
Cart Abandonment Rate | Track the number of customers who abandon their online shopping carts. | Out of 1200 initiated sales, 840 were abandoned, Abandonment Rate = 70%. |
Customer Lifetime Value (CLV) | Measure the total value a customer is expected to bring over their relationship. | The customer purchases $120 products 4 times a year for 2 years, CLV = $960. |
Brand Mentions | Monitor the frequency of brand mentions on various platforms. | Count mentions in social media, news articles, and product reviews. |
Impression Share | Quantify the brand’s performance on a channel compared to its potential audience. | For 4800 ad impressions out of 10000 potential, Impression Share = 48%. |
Customer Satisfaction (CSAT) | Gauge average customer satisfaction through ratings. | 240 out of 1200 customers rated 4 or 5, CSAT = 20%. |
Customer Effort Score (CES) | Measure how much effort customers put forth in their interactions. | 480 responses with a sum of 2160, CES = 4.5. |
Bounce Rate | Calculate the ratio of visitors who leave a page without further engagement. | 720 of 1800 visitors leave, Bounce Rate = 40%. |
Time Spent on Site | Observe the duration of site visits to evaluate engagement. | Users spend an average of 15 seconds, indicating a need for content evaluation. |
Return on Investment (ROI) | Measure the efficiency of a marketing campaign by dividing profit by cost. | $1200 spent, $600 profit, ROI = 50%. |
Email Open Rate | Determine the proportion of recipients who opened an email. | 3600 opened out of 6000, Email Open Rate = 60%. |
Click-Through Rate (CTR) | Evaluate campaign performance across various channels. | 24 clicks out of 1200 impressions, CTR = 2%. |
Cost per Lead | Calculate the cost to attract potential customer attention. | $600 spent to acquire 12 leads, Cost per Lead = $50. |
Repurchase Ratio | Provide insight into the number of customers making repeated purchases. | 120 repurchases out of 1200 customers, Repurchase Ratio = 10%. |
Return on Advertising Spend (ROAS) | Calculate revenue generated for every dollar spent on PPC advertising. | $1200 spent, $2400 revenue, ROAS = 2.0. |
Several additional metrics can help you determine the performance of your website, such as:
Web Traffic:
Track volume and source of visits to assess targeted marketing success.
Mobile Traffic:
Monitor the number of users accessing the site through mobile devices.
Screen Flow:
Chart a user’s journey around the website to optimize the user experience.
Unique Visitors:
Measure individuals who accessed the website within a specified time.
Referral Traffic:
Indicate the source of website traffic to evaluate marketing strategy effectiveness.
These extra metrics help you understand how users interact with your website. As a result, you can improve the site, enhance user experience, and assess the effectiveness of your marketing strategies.
Final Word
Marketing data analytics isn’t a luxury; it’s a necessity to get good results. Leveraging timely insights allows you to transform your marketing strategies from guesswork to precision. But how do you gather all of this customer data?
You have to first collect the necessary customer data before using it for analysis. You can either do it manually through coding, or you can use dedicated no-code data integration tools.
These integration tools connect to your CRM, ERP, and OLTP system to extract customer data and consolidate it into a central repository. These tools also allow you to automate the entire data collection process.
Learn more about integrating data and how Astera’s Data Pipeline helps companies combine their data seamlessly! Try our ETL tool for free with a 14 day trial!