

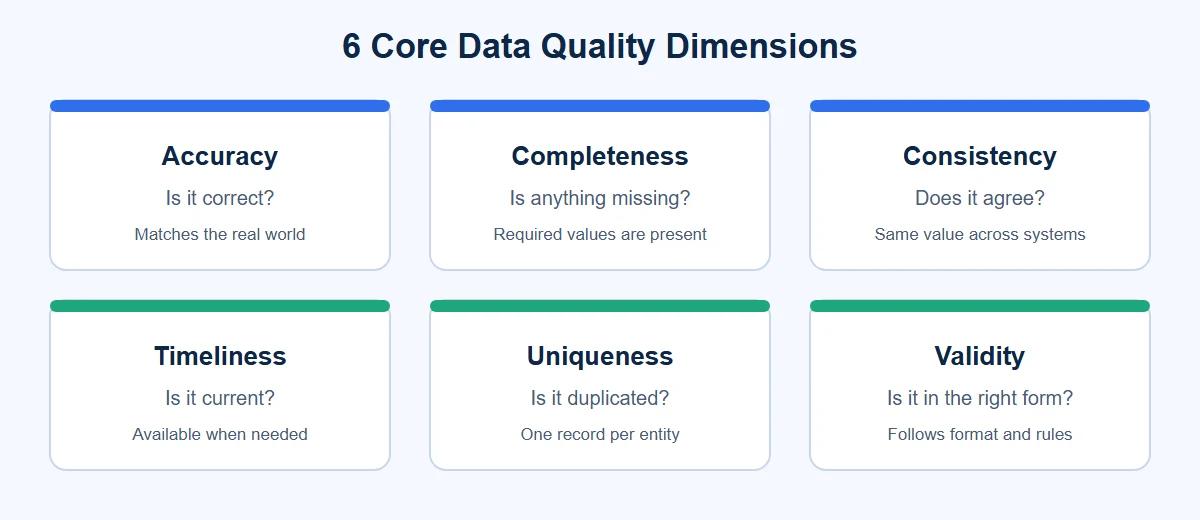
Data quality dimensions are the measurable characteristics used to judge whether data is fit for use. The six core dimensions are accuracy, completeness, consistency, timeliness, uniqueness and validity. Each one answers a different question about your data, and each can be scored with a simple formula.
Most guides stop at definitions. This one goes further: it shows how to calculate each dimension on a sample table, gives SQL checks you can adapt, explains the pairs people most often confuse, and shows which dimensions matter most for your use case.
The 6 Core Data Quality Dimensions at a Glance
Dimension | Question it answers | Typical metric | Example failure |
|---|---|---|---|
Accuracy | Does the data match reality? | % of values that match a trusted source | A customer's address is out of date |
Completeness | Are required values present? | % of required fields filled | Phone number is blank |
Consistency | Does the same fact agree across systems? | % of records that match across sources | "US" in one system, "United States" in another |
Timeliness | Is the data current and available on time? | Data age or delivery lag | Daily sales arrive after the report runs |
Uniqueness | Is each entity recorded once? | Duplicate rate | The same customer appears twice |
Validity | Does the value follow the required format or rules? | % of values that pass format checks | An email with no domain |
What Are Data Quality Dimensions?
Data quality dimensions are categories of quality that let you measure and discuss data quality in specific terms. Saying "our data is bad" can't be acted on. Saying "phone number completeness is 80% and the duplicate rate is 10%" can.
No single list is universal. The six dimensions in this guide are the ones most often used in practice and match the core set defined by the DAMA UK working group. Other frameworks add dimensions such as integrity, reliability or relevance, which are covered later in this post.
Dimensions sit between your data quality goals and the day-to-day work. Dimensions define what to check, data quality metrics are the numbers you track, and rules are the checks that produce those numbers. For the broader picture, see our guide to what data quality is and why it matters.
Why Data Quality Dimensions Matter
Poor data quality rarely fails in one dramatic way. It shows up as many small problems that each look minor: a report that does not tie out, a campaign sent twice to the same person, an order delayed by a missing field. Dimensions help you see which kind of problem you have, so you can find the cause and fix it instead of cleaning the same data again next month.
Each dimension also maps to a typical business cost:
Accuracy failures lead to wrong decisions, failed deliveries and compliance findings.
Completeness failures block processes, such as an order that cannot ship without an address.
Consistency failures cause reports from different teams to disagree, which erodes trust in the numbers.
Timeliness failures mean decisions are made on yesterday's picture, or deadlines are missed.
Uniqueness failures inflate counts, waste marketing spend and annoy customers.
Validity failures break integrations, because downstream systems reject records they cannot parse.
Measuring by dimension also makes quality a shared language. A finance lead, a data engineer and a marketer can all agree that "uniqueness for customer email must be 99%", which is far easier to act on than "the data is messy".
The 6 Core Data Quality Dimensions Explained
1. Accuracy
Definition: Accuracy is how closely data matches the real-world fact it represents.
Example: A customer moved last year, but your system still shows the old address. The address is well formatted and complete, but it is wrong.
How to measure: Compare values with a trusted reference, such as a verified address file, a source system or a manual audit sample.
Accuracy % = (values that match the reference ÷ values checked) × 100Common causes: Manual entry errors, outdated records, and bad transformations. Fix: Validate at the point of entry, reconcile against trusted sources, and correct at the source.
2. Completeness
Definition: Completeness is whether all required data is present.
Example: A customer record with no phone number or postal code cannot be used for delivery updates.
How to measure: Count the filled values for each required field. Measure the fields that matter, not every column.
Completeness % = (non-empty required values ÷ total records) × 100Common causes: Optional form fields, failed imports and missing mappings. Fix: Make critical fields required, and add checks in your pipelines. See our guide to data completeness.
3. Consistency
Definition: Consistency is whether the same data agrees across systems, tables and formats.
Example: The CRM stores the country as "US" and the billing system stores it as "United States", so a report that joins them splits one country into two.
How to measure: Compare matched records across sources, or check values against one agreed standard.
Consistency % = (records that agree or follow the standard ÷ records compared) × 100Common causes: Separate systems with different conventions. Fix: Standardize formats and reference lists, and integrate data through one governed process. See data standardization.
4. Timeliness
Definition: Timeliness is whether data is current enough, and available soon enough, for its intended use.
Example: A daily inventory feed that arrives at 7:30 a.m. is too late for a planning meeting at 7:00 a.m.
How to measure: Track data age (now minus last update) and delivery lag (arrival time minus expected time).
Data age = current time − last updated timeCommon causes: Slow batch jobs, failed syncs and stale sources. Fix: Set freshness targets per dataset, schedule or stream loads to meet them, and alert on misses.
5. Uniqueness
Definition: Uniqueness is whether each real-world entity is recorded only once.
Example: "Jon Smith" and "Jonathan Smith" with the same email appear as two customers, which inflates counts and sends duplicate mailings.
How to measure: Count duplicates using exact keys such as email or ID, and fuzzy matching for names and addresses.
Uniqueness % = (distinct entities ÷ total records) × 100Common causes: Multiple source systems and no matching rules. Fix: Match and merge records. See customer data integration for how this works across systems.
6. Validity
Definition: Validity is whether values follow the required format, type, range or business rule.
Example: The date "2026-02-30" does not exist, and "name@example" has no top-level domain.
How to measure: Apply format, range and list checks to each field. See data validation.
Validity % = (values that pass the rule ÷ values checked) × 100Common causes: Free-text fields and missing input checks. Fix: Enforce formats at entry and quarantine records that fail.
Worked Example: Scoring a Customer Table
The table below has ten customer records with deliberate problems. It shows how each dimension turns into a number.
ID | Phone | Signup date | Country | Issue | |
|---|---|---|---|---|---|
1 | a.khan@example.com | 555-0101 | 2026-01-12 | US | – |
2 | b.lee@example.com | (blank) | 2026-01-15 | US | Missing phone |
3 | c.diaz@example | 555-0103 | 2026-02-01 | MX | Invalid email |
4 | d.ross@example.com | 555-0104 | 2026-02-30 | US | Invalid date |
5 | a.khan@example.com | 555-0101 | 2026-01-12 | US | Duplicate of ID 1 |
6 | e.wong@example.com | 555-0106 | 2026-03-09 | United States | Inconsistent country |
7 | f.nair@example.com | (blank) | 2026-03-11 | IN | Missing phone |
8 | g.park@example.com | 555-0108 | 2026-03-14 | US | Email bounced when verified |
9 | h.omar@example.com | 555-0109 | 2026-03-20 | US | – |
10 | i.silva@example.com | 555-0110 | 2026-04-02 | BR | – |
Dimension | Check | Calculation | Score |
|---|---|---|---|
Completeness | Phone is filled | 8 of 10 filled | 80% |
Uniqueness | One record per email | 9 distinct emails ÷ 10 records | 90% (10% duplicates) |
Validity | Email format is valid | 9 of 10 valid | 90% |
Validity | Signup date is a real date | 9 of 10 valid | 90% |
Consistency | Country uses the 2-letter code | 9 of 10 follow the standard | 90% |
Accuracy | Email deliverable on verification | 9 of 10 deliver | 90% |
Notice that record 8 has a valid email format but still fails accuracy, and record 6 is complete and valid but fails consistency. No single dimension would have caught every problem, which is why you measure several.
SQL Checks You Can Adapt
These queries use generic SQL. Date and string functions vary by database, so adjust them to your platform.
-- Completeness: phone
SELECT 100.0 * COUNT(NULLIF(phone, '')) / COUNT(*) AS phone_completeness
FROM customers;

-- Uniqueness: email
SELECT 100.0 * COUNT(DISTINCT email) / COUNT(*) AS email_uniqueness
FROM customers;

-- Validity: basic email pattern
SELECT 100.0 * SUM(CASE WHEN email LIKE '%_@_%._%' THEN 1 ELSE 0 END) / COUNT(*) AS email_validity
FROM customers;

-- Consistency: 2-letter country code
SELECT 100.0 * SUM(CASE WHEN LENGTH(country) = 2 THEN 1 ELSE 0 END) / COUNT(*) AS country_consistency
FROM customers;

-- Timeliness: hours since the last update
SELECT CURRENT_TIMESTAMP - MAX(updated_at) AS data_age
FROM customers;

-- Accuracy: match against a trusted reference table
SELECT 100.0 * SUM(CASE WHEN c.postal_code = r.postal_code THEN 1 ELSE 0 END) / COUNT(*) AS postal_accuracy
FROM customers c JOIN reference_addresses r ON c.id = r.customer_id;
How to Combine Dimension Scores Into One Data Quality Score
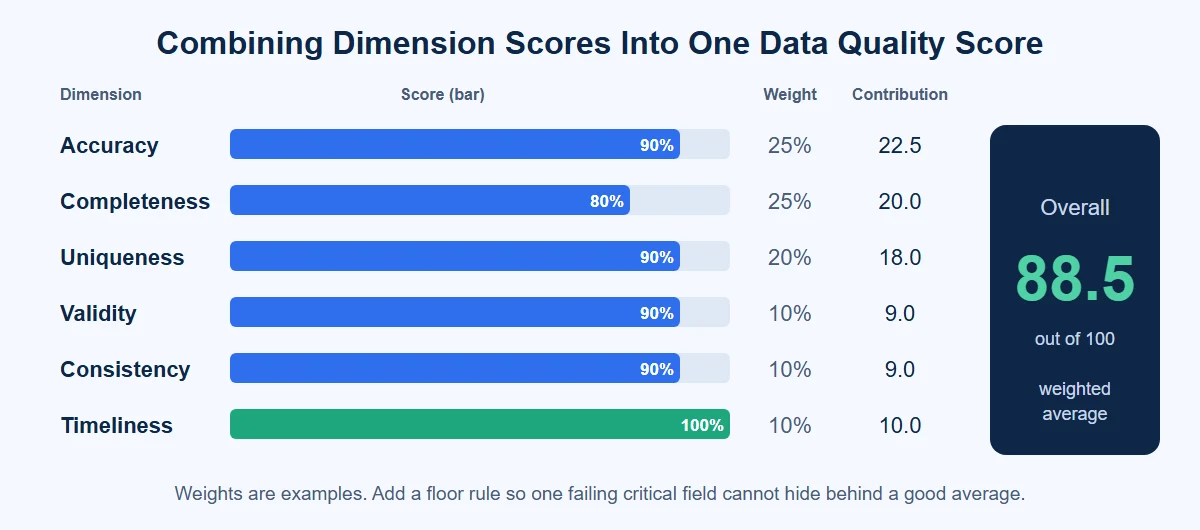
Leaders often want a single number. You can build one by giving each dimension a weight that reflects its importance for the dataset, then calculating a weighted average. Using the customer table scores above, and assuming timeliness is 100% for this example:
Dimension | Score | Weight | Contribution |
|---|---|---|---|
Accuracy | 90% | 25% | 22.5 |
Completeness | 80% | 25% | 20.0 |
Uniqueness | 90% | 20% | 18.0 |
Validity | 90% | 10% | 9.0 |
Consistency | 90% | 10% | 9.0 |
Timeliness | 100% | 10% | 10.0 |
Overall | 100% | 88.5 |
The weights are an example. Set your own with the people who use the data. A single score is useful for trends and executive reporting, but it has a weakness: a weighted average can hide a serious failure. A table could score 95 overall while 30% of its invoice amounts are wrong. To prevent that, add a floor rule, for example "any critical field below its threshold fails the dataset, whatever the overall score".
Dimensions That Are Often Confused
Pair | The difference | Example |
|---|---|---|
Accuracy vs. validity | Validity checks the form. Accuracy checks the truth. | "555-0199" is a valid phone format but may not belong to the customer. |
Completeness vs. validity | Completeness asks whether a value exists. Validity asks whether it is usable. | A postal code field holding "N/A" is complete but invalid. |
Consistency vs. accuracy | Two systems can agree and both be wrong. | Both CRM and billing show the same outdated address. |
Uniqueness vs. consistency | Uniqueness is about duplicates. Consistency is about agreement. | Two customer rows for one person is a uniqueness issue. |
Timeliness vs. accuracy | Data can be correct but too old to use. | Last month's stock level is accurate for last month only. |
Where to Check Each Dimension in Your Data Pipeline
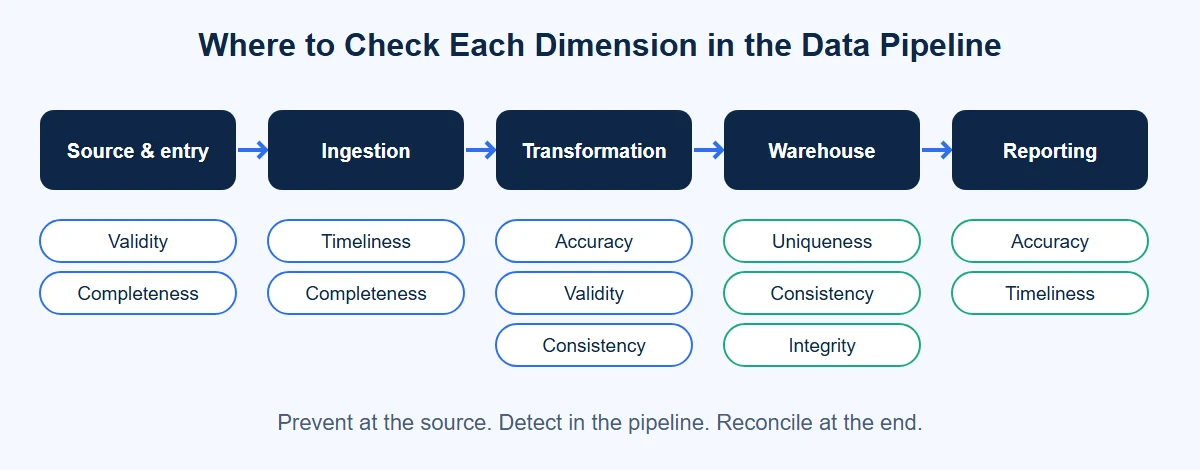
Catching a problem early is cheaper than fixing it after it has reached reports. Different dimensions are easiest to check at different stages:
Pipeline stage | Best dimensions to check | Typical checks |
|---|---|---|
Source and data entry | Validity, completeness | Required fields, format masks, dropdown lists, range limits |
Ingestion | Timeliness, completeness | Arrival time versus schedule, row counts versus the source, file size changes |
Transformation | Accuracy, validity, consistency | Type conversions, calculation checks, standard code mappings |
Storage and warehouse | Uniqueness, consistency, integrity | Duplicate keys, referential checks, cross-table comparisons |
Reporting and analytics | Accuracy, timeliness | Reconciliation to source totals, dashboard freshness |
A good rule is to prevent at the source, detect in the pipeline and reconcile at the end. Validation at entry stops bad values from spreading. Pipeline checks catch what slips through. Reconciliation confirms the final numbers match the system of record.
Which Data Quality Dimensions Matter Most for Your Use Case?
You do not need to track every dimension at the same level. Prioritize by the cost of getting each one wrong.
Use case | Most critical | Also important |
|---|---|---|
Financial reporting | Accuracy, consistency, validity | Timeliness |
Customer analytics and marketing | Uniqueness, completeness, accuracy | Validity, timeliness |
Healthcare and claims | Accuracy, validity, completeness | Timeliness, uniqueness |
Supply chain and EDI | Validity, timeliness, consistency | Accuracy |
Regulatory compliance | Accuracy, completeness, timeliness | Consistency |
Machine learning and AI | Accuracy, completeness, consistency | Uniqueness, timeliness |
Use this as a starting point, then adjust it for your own data. Our guide to data quality for AI explains why model results depend so heavily on training data. For sector-specific advice, see data quality in healthcare.
Data Quality Dimensions by Industry
The same dimension fails in different ways depending on the industry. These examples show what to watch for:
Industry | Dimension at risk | What goes wrong |
|---|---|---|
Retail and e-commerce | Uniqueness, consistency | Duplicate customer profiles, and product attributes that differ between the store, the catalog and the warehouse |
Healthcare | Accuracy, validity | Wrong patient identifiers or invalid diagnosis and procedure codes, which cause claim denials |
Banking and insurance | Accuracy, completeness | Missing or incorrect customer details that fail know-your-customer and regulatory checks |
Logistics and transportation | Timeliness, accuracy | Shipment status updates that arrive late or show the wrong location |
Manufacturing | Consistency, accuracy | Bills of materials and inventory counts that differ between the ERP and the shop floor |
Data Quality Dimensions in EDI and B2B Data Exchange
Business-to-business data exchange puts every dimension to the test, because a document that fails validation is rejected by your partner, often with a financial penalty. Electronic data interchange (EDI) is a clear example:
Validity: Each document must follow the partner's segment structure, qualifiers and code lists.
Completeness: Required segments and fields, such as a ship-to location or item number, must be present.
Consistency: The invoice must match the purchase order and the advance ship notice on quantities, prices and identifiers.
Timeliness: Documents such as ship notices must arrive within the agreed window.
Uniqueness: Interchange control numbers and document numbers must not be reused.
If you exchange documents with trading partners, our guide to EDI compliance shows how these same checks apply to partner specifications.
When Dimensions Conflict: Common Trade-Offs
Improving one dimension can hurt another, so it helps to know the trade-offs in advance:
Timeliness vs. completeness: Waiting for every source to arrive makes the data complete but late. Decide whether to publish partial data on time or complete data later.
Timeliness vs. accuracy: Extra validation and reconciliation add delay. For real-time use, you may validate lightly at speed and reconcile in a later batch.
Uniqueness vs. accuracy: Aggressive duplicate matching can merge two different people into one record, which damages accuracy. Use stricter rules for automatic merges and send borderline matches for review.
Validity vs. completeness: Strict format rules can reject records that are otherwise useful. Quarantine and fix them instead of dropping them, so you do not lose data.
Write down the choice you make for each critical dataset, and the reason. This avoids repeated debates and helps new team members understand how the data is governed.
How to Set Thresholds for Each Dimension
A threshold is the score below which data is considered unfit. There is no universal number. Set thresholds by asking what happens if the value is wrong:
Classify fields by criticality. Identifiers, amounts and regulatory fields are critical. Descriptive text is usually low risk.
Start from the business impact. If one wrong invoice amount causes a dispute, the threshold for that field should be very high.
Baseline first. Measure your current scores with profiling before you set targets, so the targets are realistic.
Tier the targets. For example, 99% or more for critical fields, 95% for standard fields and 90% for low-risk fields. These figures are examples only.
Review regularly. Tighten thresholds as quality improves and as the data takes on new uses.
Writing Dimension-Based Data Quality SLAs
Thresholds become useful when they are turned into agreements between data producers and consumers. A good statement names the dataset, the dimension, the target and the time frame. For example:
"The customer table will have at least 99% email validity and a duplicate rate below 1%, measured daily, and will be refreshed by 6:00 a.m. each day."
Add an owner who is responsible for the fix, and an escalation path for when the target is missed. This is the foundation of a data contract, and it supports your wider data governance program.
Other Data Quality Dimensions Beyond the Core Six
Many frameworks add further dimensions. Which ones to include depends on your industry and goals:
Integrity: Relationships between data are preserved, such as every order linking to an existing customer.
Reliability: Data comes from a trusted source and can be depended on over time.
Relevance: Data is useful for the purpose it is being used for.
Accessibility: Authorized users can find and retrieve the data when needed.
Granularity: Data has the right level of detail, such as transaction-level versus monthly totals.
The range is wide. One DAMA working group catalogued a longlist of about 60 dimensions before narrowing it down. In practice, start with the six core dimensions, and add others only when you can define a clear check and an owner for each.
How to Put Data Quality Dimensions Into Practice
Profile your data. Measure the current state with data profiling to find where dimensions fail.
Pick dimensions per dataset. Use the use-case table above, and write one rule per dimension and field.
Set thresholds and owners. Agree on a target, such as 98% completeness for postal code, and name who is responsible.
Automate the checks. Run rules inside your pipelines so bad data is flagged or cleansed before it reaches reports.
Monitor and fix at the source. Track scores over time and trace failures back to their cause, instead of repeatedly cleaning the same data.
Manual spreadsheets and ad hoc SQL work for a few tables but do not scale. A data quality tool lets you define rules once, apply them across sources and watch scores in one place. Learn how this fits into a wider data quality framework and data quality management program.
Troubleshooting: Symptoms, Root Causes and Fixes
When a score drops, work from the symptom back to the cause. This table covers the most common patterns:
Symptom | Dimension | Likely root cause | Fix |
|---|---|---|---|
Reports from two teams disagree | Consistency | Different definitions or code lists in each system | Agree on one definition and a shared reference list |
Sudden rise in blank fields | Completeness | A source change, failed mapping or a form field made optional | Check the latest source and pipeline changes, then restore the mapping |
Customer counts are higher than expected | Uniqueness | Multiple systems create the same customer with no matching rule | Add matching and merge rules, and a shared customer ID |
Records are rejected downstream | Validity | No format check at entry, or a changed target specification | Validate at entry and update rules when specifications change |
Dashboards show yesterday's numbers | Timeliness | A failed or delayed job, or a slow source | Add freshness alerts and retry logic, and review the schedule |
Numbers do not match the source system | Accuracy | A faulty transformation, rounding or a stale lookup | Reconcile totals at each stage to find where they diverge |
The aim is to fix the cause once, not clean the output every time. After a fix, backfill the affected records and add a rule that would have caught the issue earlier.
Common Mistakes When Using Data Quality Dimensions
Measuring everything equally. Tracking every column dilutes attention. Focus on critical fields.
Confusing validity with accuracy. A correctly formatted value can still be wrong. Use a reference check for accuracy.
Setting targets without a baseline. Unrealistic thresholds are ignored. Profile first.
Having no owner. Scores without an accountable person do not improve.
Cleaning downstream only. Fixing data in reports leaves the source broken, so the problem returns.
Checking once. Quality changes as systems and sources change. Monitor continuously.
Relying on one overall score. It can hide a critical failure. Keep dimension and field-level views.
Data Quality Scorecard Template
Copy this layout to report on each dataset. The targets shown are examples. Set your own based on risk.
Dataset / field | Dimension | Rule | Target | Current | Owner |
|---|---|---|---|---|---|
Customers / email | Validity | Matches email pattern | 99% | 90% | CRM owner |
Customers / phone | Completeness | Not empty | 95% | 80% | Sales ops |
Customers / record | Uniqueness | One record per email | 99% | 90% | Data steward |
Orders / load time | Timeliness | Loaded by 6:00 a.m. | 100% | – | Data engineering |
Conclusion
Data quality dimensions turn a vague goal into measurable checks. Start with the six core dimensions, score a real dataset using the formulas and SQL above, and prioritize the dimensions that carry the most risk for your use case. Then automate the rules so quality is monitored continuously instead of fixed once.
Ready to automate data quality checks across your sources? Talk to our team to see how Astera helps you profile, validate and cleanse data in one place.