

Agentic analytics uses AI agents to take a business question, plan the analysis, run it across your data, check the result and explain what they found. You ask a question in plain language. The agent prepares the data, does the calculations and gives you a first interpretation.
Many "ask your data" tools have promised this for years. What changes with an agent is that it builds and runs the analysis, and you can see each step. This guide explains how that works, where it falls short, and how to tell a real agentic tool from a chatbot that sits on top of a dashboard.
What is agentic analytics?
Agentic analytics is a way of analyzing data in which AI agents do the steps an analyst would normally do. They understand the question, find and prepare the data, run the calculations, check the output and summarize it. The agent works toward a goal, such as "why did cost per qualified lead rise in March?" A single prompt can't handle that on its own.
Three features define it:
It plans. It splits a question into steps and decides the order.
It executes. It builds and runs the data workflow that produces the answer. You can inspect the workflow and run it again.
You can check it. You can see the steps, the data and the numbers. You can accept, correct or redirect the result.
These three features come from the same idea: an AI agent that works toward a goal. You may already know generative AI, such as chat assistants that write and summarize. The next section shows how the two relate.
What is the difference between agentic AI and generative AI?
Generative AI creates content from a prompt. Agentic AI plans, uses tools and checks its work in a loop until it reaches a goal.
Generative AI produces content, such as text, code or a summary. Agentic AI uses a model as the reasoning engine inside a loop. It makes a plan, uses tools, checks the result and decides the next step. Agentic analytics, also called agentic AI for data analytics, applies that loop to data. The tools are data connections, preparation steps and calculations. The output is an analysis you can inspect. You may also wonder how it compares with the analytics tools you already use. That comparison comes next.
How is agentic analytics different from BI, copilots and text-to-SQL?
Agentic analytics plans and runs a whole analysis from a goal. Dashboards, BI copilots and text-to-SQL answer one question at a time, and they work on data that someone has already prepared. The table shows what each one does and where it usually stops.
What you do | What the tool does | Typical limit | |
|---|---|---|---|
Dashboards | Open a report and read it | Shows pre-built charts | Only answers questions someone planned for |
Natural-language query / BI copilot | Ask a question in plain language | Translates it into a query or chart | One question at a time; someone must prepare the data first |
Text-to-SQL | Ask a question | Generates SQL against a modeled database | Doesn't prepare or reconcile messy sources |
Augmented analytics | Review suggested insights | Surfaces patterns and recommendations | Assists the analyst; doesn't run multi-step investigations |
Agentic analytics | State a goal | Plans, prepares data, executes, checks, explains | Quality depends on your data and on how clearly the tool shows its steps |
Text-to-SQL is one component of agentic analytics. It doesn't cover preparing data or running multi-step analysis.
How agentic analytics works, step by step
Agentic analytics works in a loop of six steps: interpret, plan, prepare data, execute, check and hand back.
Analysis rarely ends with one answer. You ask a question, look at the result and ask the next one. An agent follows the same rhythm. It works in a loop, and each step feeds the next.
The six steps below follow one example question: "Why did cost per MQL jump in March?" The agent runs the first five steps on its own. You come back in at step six to review the result and decide what happens next.
Along the way, the agent uses tools such as data connections, preparation steps and calculations. It carries the earlier steps forward, so a follow-up question builds on the work already done.
Here are the six steps:
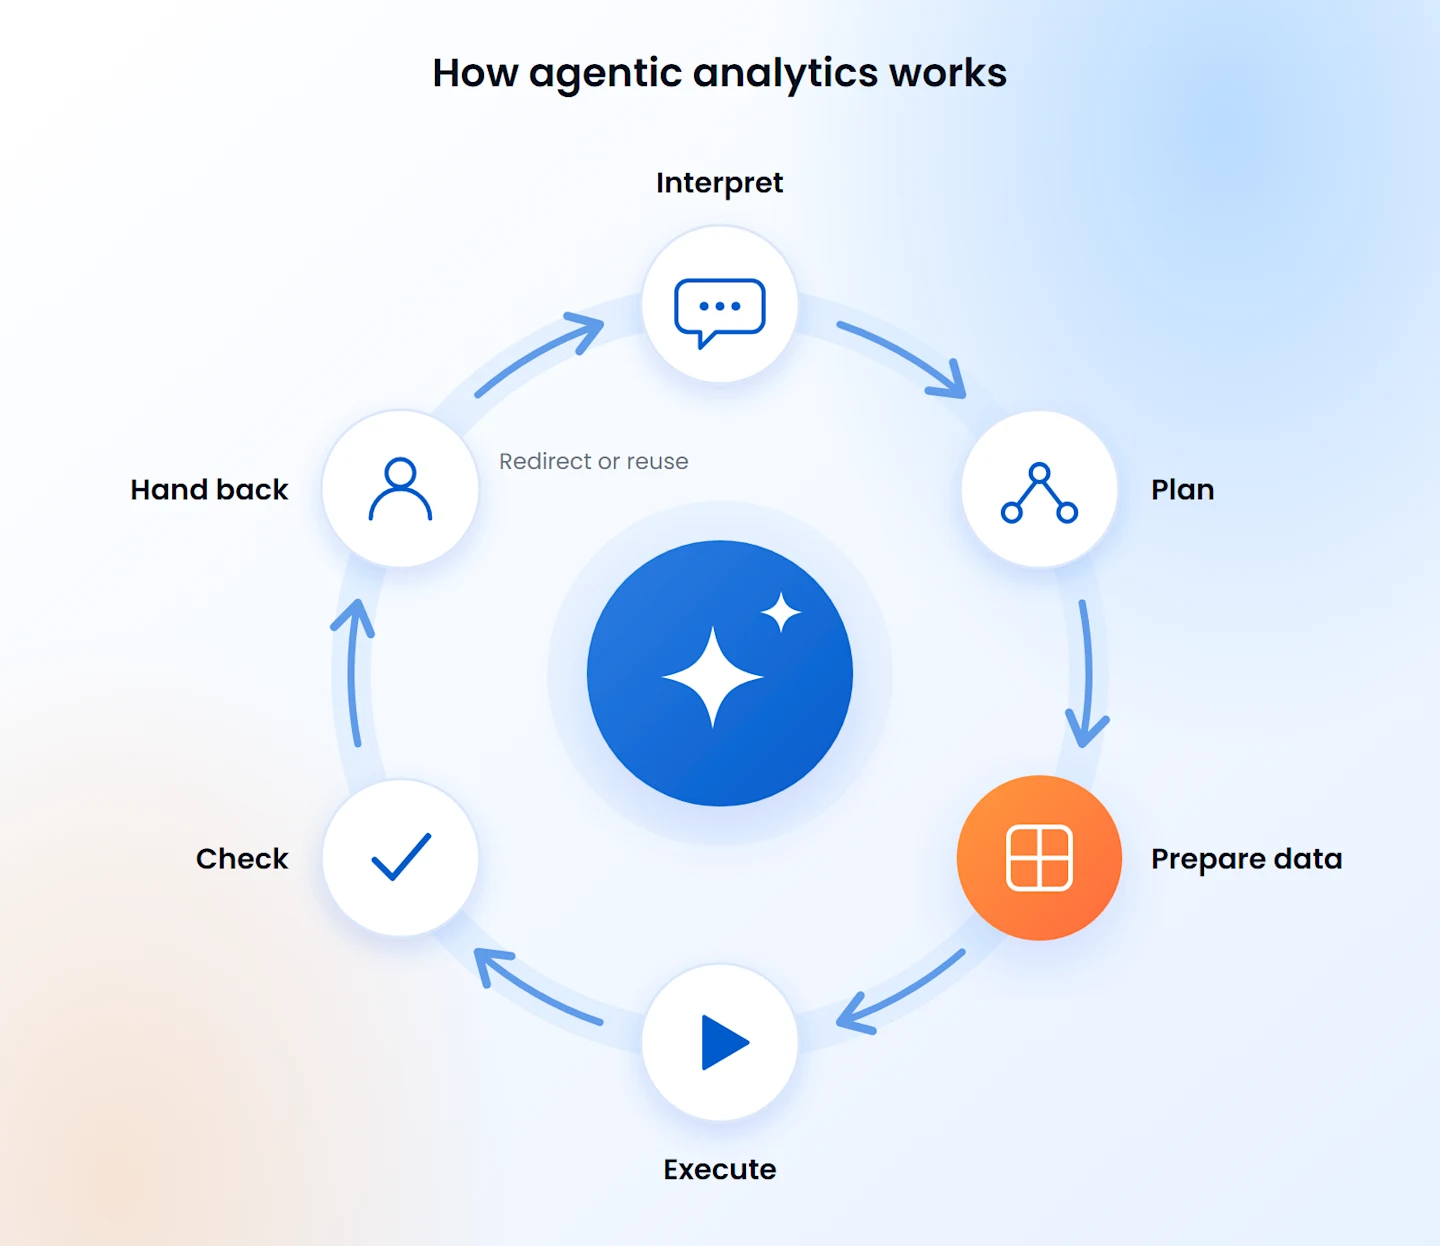
Interpret the question. "Why did cost per MQL jump in March?" becomes a list of things to check: spend, lead eligibility, MQL rate, opportunities and pipeline by campaign and month.
Plan the workflow. The agent decides which sources it needs and what to join, filter and calculate.
Prepare and combine the data. The agent builds a data-preparation workflow that combines campaign, spend, lead and opportunity files.
Execute. The workflow runs and produces output you can inspect.
Check and explain. The agent compares results, flags anything that looks off and offers alternative explanations.
Hand back control. You review the result, ask a follow-up question or reuse the workflow.
Step three often takes the most effort. Your data sits in several files, and each file can describe the same thing differently. One file might list a campaign as "Social Prospecting" and another as "social_prospecting". The agent has to match them, or the numbers split into two campaigns. Teams can also define a term like "MQL" in different ways, so the agent needs one definition before it counts anything.
An error here carries into every later step. For that reason, you want to see how the agent prepared the data. When you can inspect the workflow, you can check the matches and definitions, fix any mistake and run the same steps again next month.
What industry leaders say about agentic analytics
Agentic analytics is a young category. Gartner published a market guide for it in 2025, and vendors still describe it in different ways. The views of analysts and vendor leaders show where the market agrees and where it still debates. They also help you judge the claims you hear in demos.
Vendor leaders have products to sell, so treat their points as perspectives. Analyst research gives a more neutral view. Here is what each of them says.
Gartner defines agentic analytics as software that applies AI agents across the data-to-insight workflow. The agents work semi-autonomously or autonomously toward stated goals. Gartner describes it as the next step after augmented analytics. Its 2025 market guide calls the market early and sees the main value in automating tasks such as data preparation and insight generation.
Ketan Karkhanis, CEO of ThoughtSpot, told diginomica that most people don't want to build dashboards. He argues that useful agents need a semantic layer that covers structured and unstructured data. He also warns that many agents sound confident when they are wrong.
Jane Smith, field chief data and AI officer at ThoughtSpot, describes a move from passive reporting to active decision-making. In her view, agents can monitor data and diagnose why it changed.
Julio Avalos, co-CEO of Observable, points to a move away from dashboard-driven work toward continuous, collaborative analysis.
Zoho argues that success depends on a well-governed data foundation as well as a capable model.
Three themes run through these views. Analysis is moving from reading reports to delegating work. Trust depends on what sits under the agent: the data, the definitions and the preparation. The main risk is a confident wrong answer. This guide returns to preparation, visible steps and verification for that reason.
Maha Hanfi, Director of Product Strategy & Growth at Astera, adds the view from our side:
"Most analysts spend the first hours of any question cleaning and joining files. An agent can do that prep, run the analysis and show every step it took, so the team can trace how it got to each number. People still own the definitions and the decisions. The agent recommends; the team decides."
What agentic analytics looks like in practice: a marketing funnel example
A marketing team asks a common question: "Why did cost per MQL jump in March?" The answer sits in three files: campaign spend, leads and opportunities. Here is a small sample of each for one campaign.
Spend file
campaign | month | spend |
|---|---|---|
Social Prospecting | Feb | $9,300 |
Social Prospecting | March | $9,200 |
Leads file
campaign | month | leads | MQLs |
|---|---|---|---|
social_prospecting | Feb | 120 | 30 |
social_prospecting | March | 118 | 8 |
Opportunities file
campaign | month | opportunities | pipeline |
|---|---|---|---|
Social Prospecting | Feb | 6 | $23,250 |
Social Prospecting | March | 2 | $8,000 |
The leads file spells the campaign name differently from the other two. The agent has to match the names before it can add anything up.
What the agent does. It matches the names and combines the three files. For each campaign and month, it calculates spend, leads, MQLs, cost per MQL, opportunities and pipeline. The full run covers several campaigns and months, which gives twelve campaign-month records, and the totals match the source files. Here are the two rows for this campaign:
month | spend | leads | MQLs | cost per MQL | opportunities | pipeline |
|---|---|---|---|---|---|---|
Feb | $9,300 | 120 | 30 | $310 | 6 | $23,250 |
March | $9,200 | 118 | 8 | $1,150 | 2 | $8,000 |
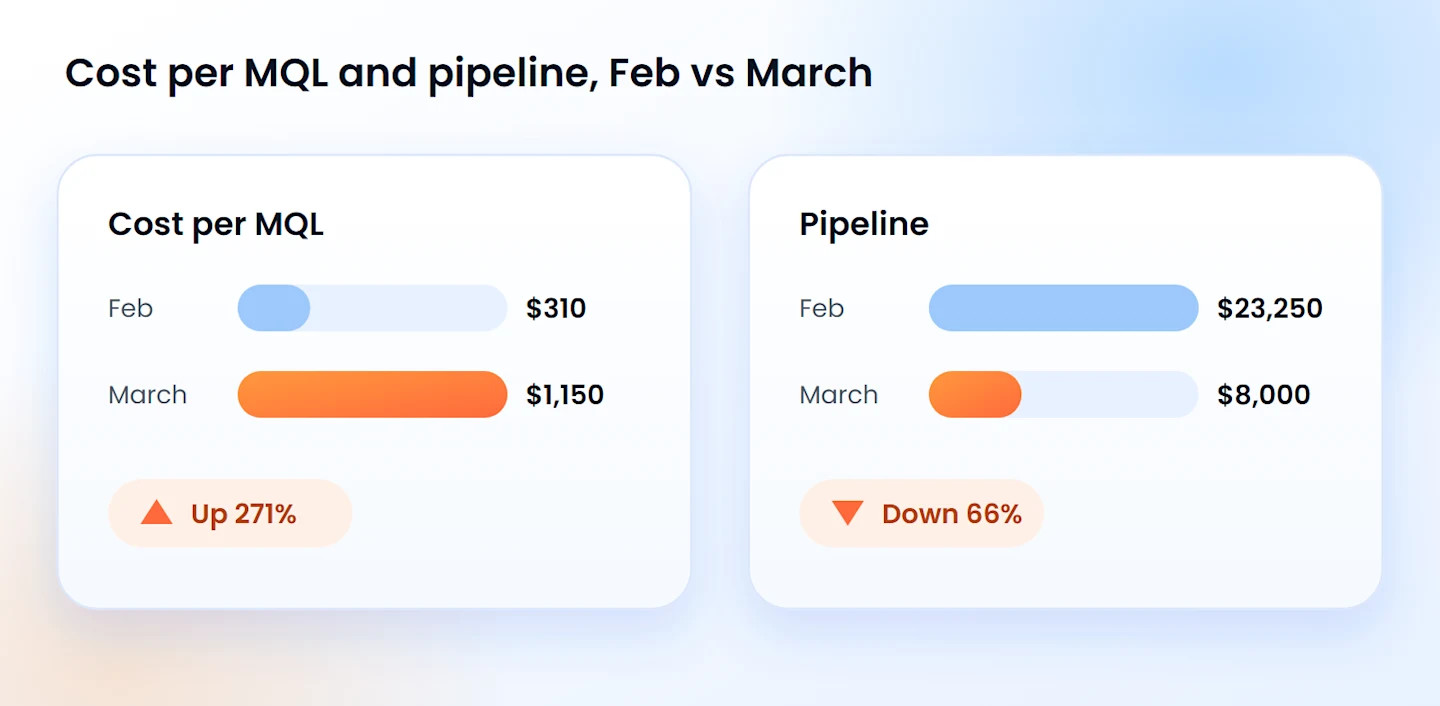
What it finds. Spend and lead volume stayed almost the same. Far fewer leads became MQLs, so cost per MQL rose from $310 to $1,150 and pipeline fell from $23,250 to $8,000. The change appears between the lead stage and the MQL stage.
What you do next. You review the steps the agent took and check the numbers against the source files. Then you decide what to ask next.
Treat this result as a lead, and test it before you act. The agent found where the change happened, and finding out why takes more work. Cost per MQL rose and pipeline fell in the same campaign and month. That pattern tells you where to look. The cause could be lead quality, a change in qualification rules, tracking or targeting, and the files alone can't say which.
Follow-up questions help narrow it down. You can ask the agent to split the campaign by audience or ad, or to check whether tracking changed in March. Each answer comes with its steps, so you can see how the agent got there.
Those steps matter because the quality of an answer depends on what goes into it. Clean data, consistent definitions for terms like MQL and a clear question all lead to better results. Review the steps before you rely on the answer.
What agentic analytics still can't do
Agentic analytics can't prove causes, fix poor data or settle conflicting definitions, and it works best with a person in charge.
The example above shows what an agent does well. It prepares data quickly and points you to where a metric changed. Knowing the limits helps you set realistic expectations and decide where a person needs to step in. These are the five that matter most.
It doesn't prove causes. Agents find correlations and plausible explanations fast. They don't run controlled tests.
It depends on your data quality. Duplicate records, inconsistent definitions and missing fields flow into the answers unless the preparation step catches them.
Definitions matter. If "MQL" or "pipeline" means different things to different teams, the agent can't settle that for you.
Forecasts depend on the method. In an example back-test over six months, a seasonal baseline forecast had a mean absolute percentage error of about 18%. That is useful for a planning baseline. A fitted model would do more.
Autonomy comes in degrees. Be wary of anyone who claims a fully autonomous analyst.
Most of these limits trace back to the data and the definitions behind the agent. That makes the foundation worth getting right, and the next section covers it.
What you need before adopting agentic analytics
You need four things before you adopt agentic analytics: data you can combine, one definition per KPI, access and review rules, and a way to verify results.
An agent can only work with what you give it. These basics decide how well it performs, and you can set up most of them before you pick a tool.
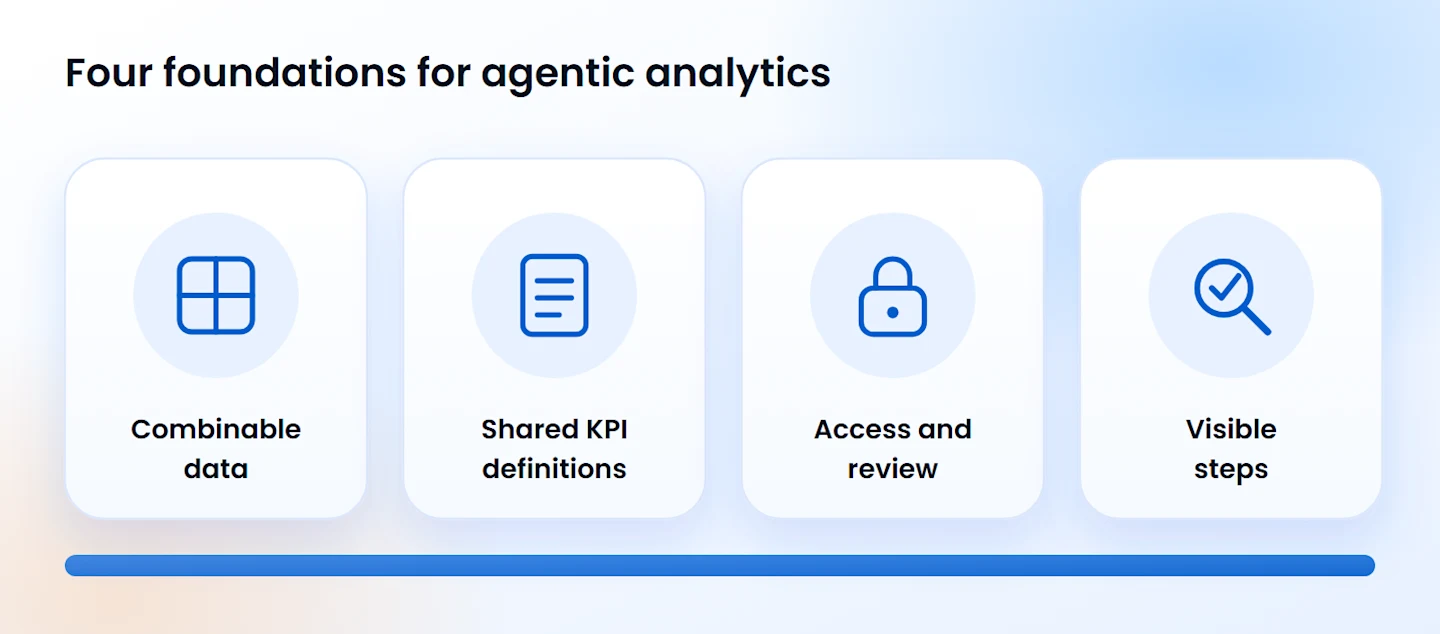
Data you can combine. Your files need something in common, such as a campaign name or an ID, so the agent can join them. When names or formats differ, as in the example above, the agent can match them. A clear shared key makes the match more reliable. Start by listing the sources behind the questions you ask most.
One definition per KPI. Agree on a single definition for each metric. If marketing and sales both count MQLs but apply different rules, the agent can only follow the rule you give it. Write the definitions down so the agent and your team use the same ones.
Access and review. Decide who can ask the agent what, and which data it can see. Name the person who checks results before they reach a decision. A short review step helps catch errors early.
A way to verify. Choose a tool that shows its steps and the data behind each answer. Then you can trace any number back to its source, which makes review quick.
With these basics in place, you can pick the use cases where an agent saves the most time. The next section covers them.
Where agentic analytics helps most
AI agents for data analysis help most with funnel investigations, baseline forecasting, anomaly checks and reconciling numbers across systems.
Agents save the most time on questions that need several files, come up again and again, and have a clear metric behind them. These four use cases fit that pattern.
Marketing and sales funnels. Investigate changes in cost per lead, conversion and pipeline across campaigns. The example above is one case. The question spans spend, leads and opportunities, and the answer comes from combining them.
Baseline forecasting. Build a quick seasonal or growth baseline, then back-test it against past months to see how far you can trust it. You get a planning number fast and can refine it later.
On-demand anomaly checks. Ask "what changed?" when a KPI moves. The agent compares periods, segments and sources, and shows where the numbers diverge.
Reconciling numbers across systems. Ask the agent to compare figures from two sources, such as marketing and finance, and show the mismatches before a review.
How can AI agents help analytics teams?
AI agents help analytics teams by taking over data preparation and first-pass investigation, which frees analysts for judgment.
Beyond single questions, an agent changes how your team spends its week. The biggest shift is where the hours go.
Less time on preparation. Joining, cleaning and reconciling files is the slowest part of most requests. An agent can build that workflow first, so you start from prepared data.
A faster first pass. You start from a worked answer to review and correct, with no blank query. You send each correction back to the agent as a follow-up question.
Reusable work. A one-off investigation becomes a saved workflow. Next month, you rerun the same steps on new files.
More time for judgment. You still define the metrics, decide what a finding means and present it. With preparation off your plate, you spend more of the week on those decisions.
Agents help only when you can see their steps and stay in the loop. That is also the test to apply when you compare tools, so the next section covers how to evaluate them.
How to evaluate an agentic analytics tool
Evaluate an agentic analytics platform on six things: your data sources, metric definitions, what the agent runs, how you check the numbers, access controls and how it handles mistakes.
Most demos look good on clean sample data. A fair comparison needs the same questions, run on your own data. The six questions below follow the path of an analysis, from your data to what happens when something goes wrong.
Which of your data sources can it connect to, and how does it handle messy data from several of them? Ask to watch it match mismatched names, spot duplicates and flag blank fields, as in the example earlier.
How does it control metric definitions? You want each KPI defined once, in one place, so every answer uses the same rule.
Does the agent run a workflow you can inspect, or does it only generate text and charts? A workflow lets you check the logic and rerun it. Text alone gives you nothing to check.
Can you see each step, the data it used and the calculation behind every number? If you can trace a figure back to its source rows, you can verify it yourself.
What access controls apply to what the agent can see and do? The agent should only reach data that the person asking may see. Ask how the tool enforces that.
What happens when the agent is wrong, and how will you find out? Look for step logs, flags on uncertain results and a clear way to correct the answer and rerun it.
How to run the evaluation
An enterprise evaluation takes more than one demo. Treat it as a short pilot with clear owners, shared test data and a scoring plan.
Set the scope and the success criteria. Pick two or three business questions the agent must answer, such as the funnel question above. Define what a good answer looks like, how fast you need it and how much error you will accept.
Assemble the team. Bring in the business owner who asks the questions, an analyst who knows the data, someone from data engineering, and security and compliance. Each person scores the areas they know best.
Build a test set. Use real files from at least two systems, and leave the messy parts in: mismatched names, duplicates and blank fields. Mask sensitive data first, and agree where the vendor may process the rest.
Run every vendor the same way. Give each vendor the same questions and the same files, and score them with the same sheet. Set a fixed window, such as two to four weeks, and move only the best two or three vendors into a hands-on pilot.
Score and compare. Rate each answer against the six questions, and record what you see. Put the total scores and the gaps side by side.
Check security, cost and fit. Review how each tool handles access, logging and data residency. Work out what it costs at your data volume and number of users. Test how it connects to the systems you already run.
Decide and plan the rollout. Choose the tool that scores best on your questions. Start with one team, one use case and a review step, and expand after that first rollout works.
What to ask each vendor to show
A good pilot tests more than the happy path. Ask each vendor to show these in front of you, on your files.
Data and accuracy
Your question, start to finish. Ask the vendor to connect to a sample of your data and answer your question, with nobody preparing the files beforehand. Watch how long setup takes and what the vendor adjusts by hand.
A messy file. Add duplicates, blank fields and mismatched names. The tool should flag each problem and show how it fixed it, with a record of every change.
A planted error. Give the agent a wrong definition or a bad value. See how the tool flags it, and how you correct the answer and rerun it.
A follow-up question. Ask a second question that builds on the first answer. This shows whether the agent keeps track of its earlier work.
Control and security
The audit trail. Open the log for one run. Look for who asked, which data the agent used, which steps it ran and when.
Permissions at work. Ask the same question as two people with different access. Each answer should match what that person may see.
Scale and support
A repeat run at volume. Rerun the same workflow on new data, then on a much larger file. The steps should stay the same, and you should see how speed and limits change.
Your systems. Ask the vendor to show the connection to the warehouse, CRM or other systems you run, and how often the data refreshes.
The full price. Ask for the cost in writing at your data volume and number of users, and what drives usage charges.
A reference. Ask to speak with an enterprise customer who runs a similar analysis. Ask how long rollout took, what went wrong and how support responded.
Start with one question
Agentic analytics targets the slow part of analysis: preparing data and running the steps between a question and an answer. A good test for any tool is whether you can see and verify what the agent did.
See what an agent can build from your own data. Bring one question to our team and we'll show you how Astera DataPrep would work through it. Talk to our team