

AI agents for data analysis build the workflow behind a question. They match your files, combine them, calculate the KPIs and show you each step. This guide follows one agent through a common marketing question: why did cost per MQL jump in March?
You will see the three input files, the plan the agent makes, the table it builds and the finding it reports. You will also see how to check the work before you rely on it.
What is an AI agent for data analysis?
An AI agent for data analysis is software that plans an analysis, builds the workflow to run it and explains the result. You describe the question in plain language, and the agent works out the steps.
A general chat assistant answers from the text you give it. An agent connects to your files, runs the calculations and keeps a record of every step. That record lets you check the answer.
You may see the same idea under other names, such as AI agents for analytics, data agents, analytics agents or an AI data analyst. They all describe an agent that does the analysis work. This is the working part of agentic analytics, the approach in which an AI agent carries out an analysis from a goal.
The next sections follow one example from question to finding. First come the KPIs and the data.
Which KPIs does this example use?
The example uses five funnel metrics: spend, cost per MQL, MQL rate, opportunity rate and pipeline.
An MQL, or marketing qualified lead, is a lead that meets your criteria for sales follow-up. You track how many leads reach that stage and what each one costs. Here is how the agent does each KPI calculation:
Cost per MQL equals spend divided by MQLs.
MQL rate equals MQLs divided by leads.
Opportunity rate equals opportunities divided by MQLs.
Pipeline is the total value of the opportunities.
These formulas look simple. The effort sits in getting spend, leads and opportunities into one place, because each one lives in a different file.
What data does the agent start with?
The agent starts with three files for one campaign: spend, leads and opportunities. Each file comes from a different system, and each covers February and March.
Spend file
campaign | month | spend |
|---|---|---|
Social Prospecting | Feb | $9,300 |
Social Prospecting | March | $9,200 |
Leads file
campaign | month | leads | MQLs |
|---|---|---|---|
social_prospecting | Feb | 120 | 30 |
social_prospecting | March | 118 | 8 |
Opportunities file
campaign | month | opportunities | pipeline |
|---|---|---|---|
Social Prospecting | Feb | 6 | $23,250 |
Social Prospecting | March | 2 | $8,000 |
Look at the campaign name. The spend and opportunities files write it "Social Prospecting". The leads file writes it "social_prospecting". A person sees one campaign. A calculation sees two.
If the agent joined the files as they are, the leads would not line up with the spend, and cost per MQL would come out wrong. The names have to match first. Analysts call this kind of work data blending. In marketing, it is part of marketing data integration.
How does an AI agent build a multi-source KPI workflow?
An AI agent builds a KPI workflow in six steps. It interprets the question, plans the steps, matches and combines the files, calculates the KPIs, compares the months and hands the result back to you.
Astera DataPrep builds this kind of workflow from a plain-language request. You type the question, and the agent does the rest. The picture shows the path from three files to one table, and the steps below describe each stage.
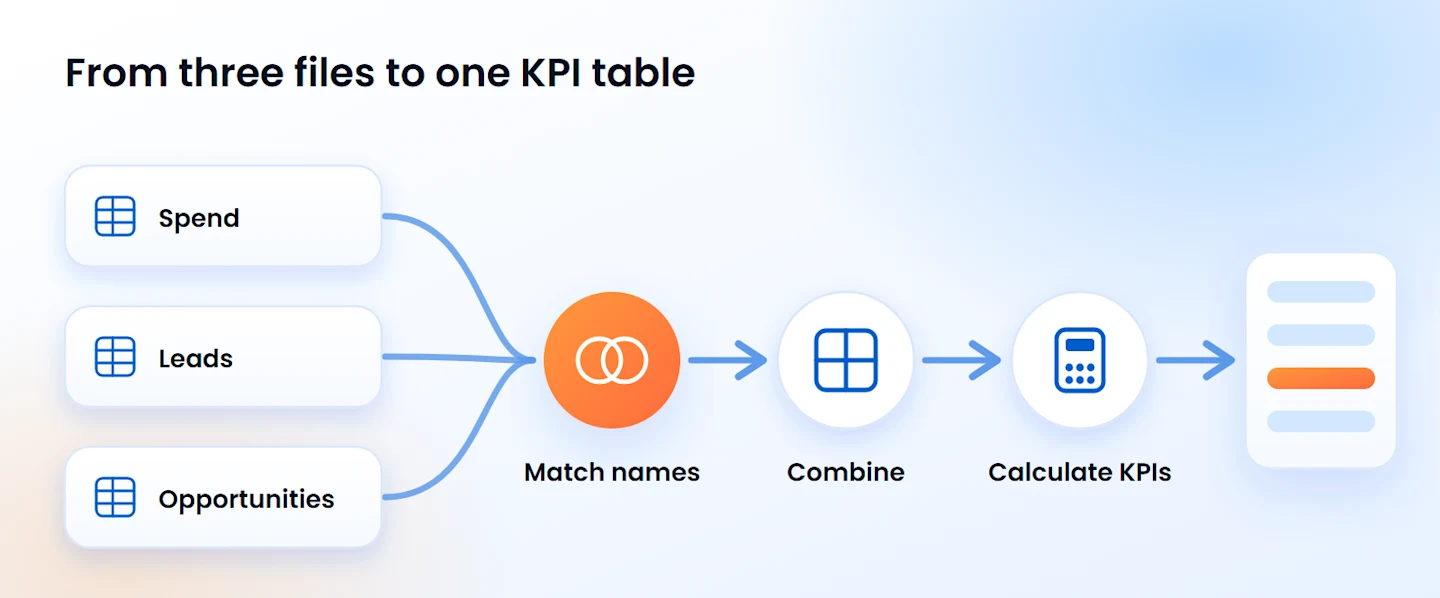
Here are the six steps:
Interpret the question. You ask, "Why did cost per MQL jump in March?" The agent turns that into checks: spend, leads, MQLs, opportunities and pipeline for each campaign and month, compared across February and March.
Plan the workflow. The agent lists its steps before it runs anything. It plans to match campaign names across the three files, combine them by campaign and month, calculate the KPIs, compare the months and flag the biggest change.
Match and combine the files. The agent recognizes that "social_prospecting" and "Social Prospecting" name the same campaign. It reports the match so you can review it, then joins the rows by campaign and month. Across the full dataset, this gives twelve campaign-month records.
Calculate the KPIs. For each campaign and month, the agent works out cost per MQL, MQL rate, opportunity rate and pipeline.
Compare and flag. The agent compares February with March and looks for the largest change.
Hand back the result. The agent shows you the table, the finding and the steps. You review them, ask a follow-up question or run the workflow again later.
Here is the table for the example campaign after step four:
month | spend | leads | MQLs | cost per MQL | MQL rate | opportunities | opportunity rate | pipeline |
|---|---|---|---|---|---|---|---|---|
Feb | $9,300 | 120 | 30 | $310 | 25.0% | 6 | 20.0% | $23,250 |
March | $9,200 | 118 | 8 | $1,150 | 6.8% | 2 | 25.0% | $8,000 |
The totals match the source files. February and March spend add up to $18,500, the same as the two rows in the spend file.
Curious how this workflow would handle your files?
Talk to our team to get a personalized walkthrough
How does Astera DataPrep run this example?
Astera DataPrep runs the example from one plain-language request. You attach the spend, leads and opportunities files, send your question and follow the agent as it works. The run has six parts.
The request
You attach the three files and send a message like this one:
Combine these three files by campaign and month, calculate cost per MQL, lead to MQL rate and MQL to opportunity rate, and tell me why cost per MQL jumped in March for Social Prospecting.
The plan
The agent reads the structure of all three files and writes a five-item task list: load and inspect the files, combine them by campaign and month, calculate the KPIs, investigate the March change and deliver the findings. Each item updates as the agent works, so you always see where it is.
The name match
The agent notices that the leads file writes "social_prospecting" while the other two files write "Social Prospecting". It normalizes the names before it joins the files, and it tells you what it changed. It also suggests fixing the names at the source, so future files don't need the extra step.
The combined table
The table opens in a panel beside the chat, with one row for each campaign and month. Every row carries spend, leads, MQLs, opportunities, pipeline, cost per MQL, MQL rate and opportunity rate. Tabs on the panel let you read the output, the source of the calculation and a trace of the steps. The Social Prospecting rows match the table above: cost per MQL of $310 in February and $1,150 in March.
Follow-up questions
Ask which other campaign changed most between February and March, and the agent ranks all six campaigns by their change in a second table. Retargeting comes next after Social Prospecting:
Retargeting | Feb | March | change |
|---|---|---|---|
Spend | $4,800 | $5,000 | +4.2% |
Opportunities | 4 | 5 | +25% |
Pipeline | $14,000 | $18,000 | +28.6% |
Cost per MQL | $252.63 | $238.10 | -5.8% |
The other four campaigns moved less.
Charts
You can also ask for charts. The prompt below asks for three: lead to MQL rate by campaign, cost per MQL for Social Prospecting and pipeline by campaign, each for February versus March. The agent builds them from the same files and shows them beside the chat.
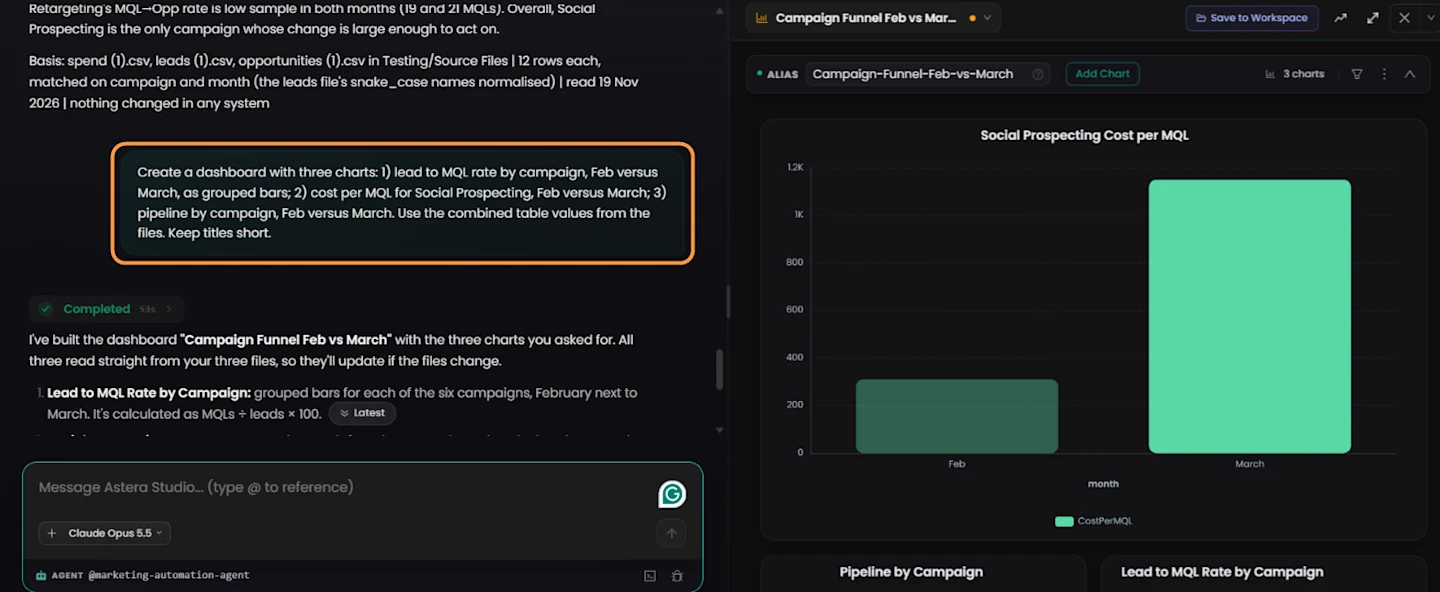
Here is what the three charts show:
Cost per MQL for Social Prospecting: about $310 in February and $1,150 in March.
Pipeline by campaign: Social Prospecting falls from $23,250 to $8,000 while Retargeting grows.
Lead to MQL rate by campaign: Social Prospecting drops from 25.0% to about 7% while the other campaigns hold steady.
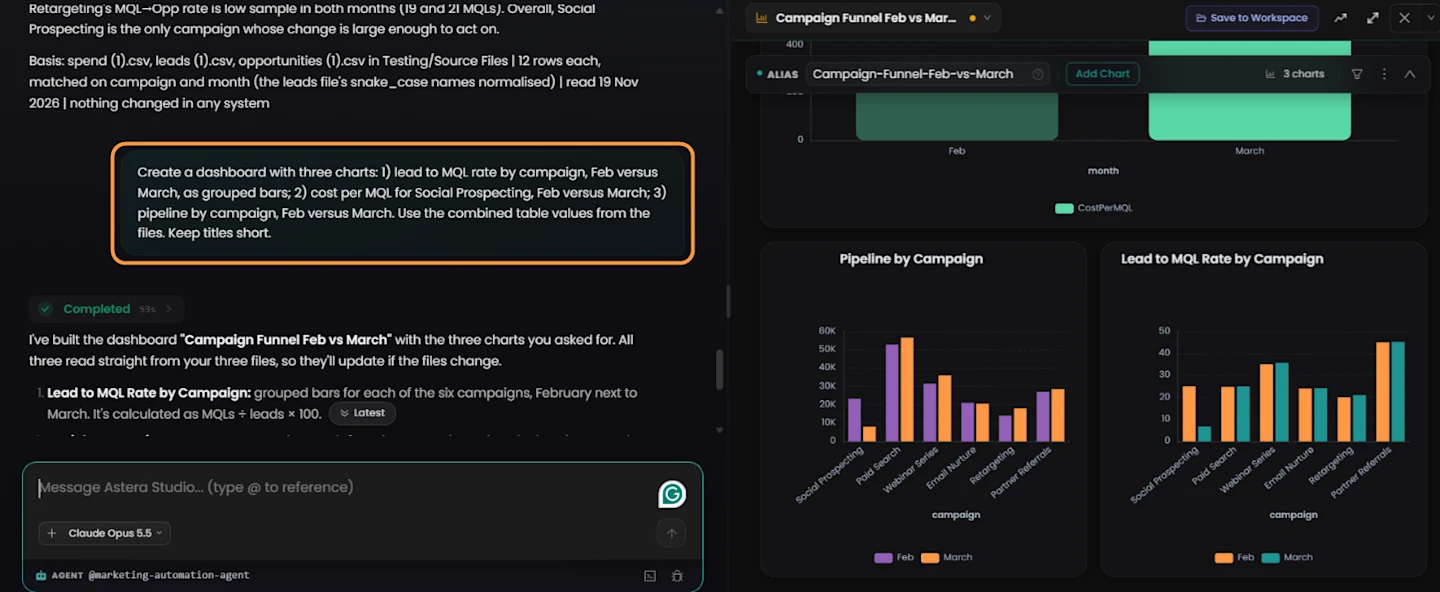
That puts the whole run in one place, from three files to a ranked list of changes and a set of charts. The next section turns the Social Prospecting rows into a finding.
What does the agent find?
The agent finds that the change happens at qualification. Spend and lead volume stayed almost level, but far fewer leads became MQLs.
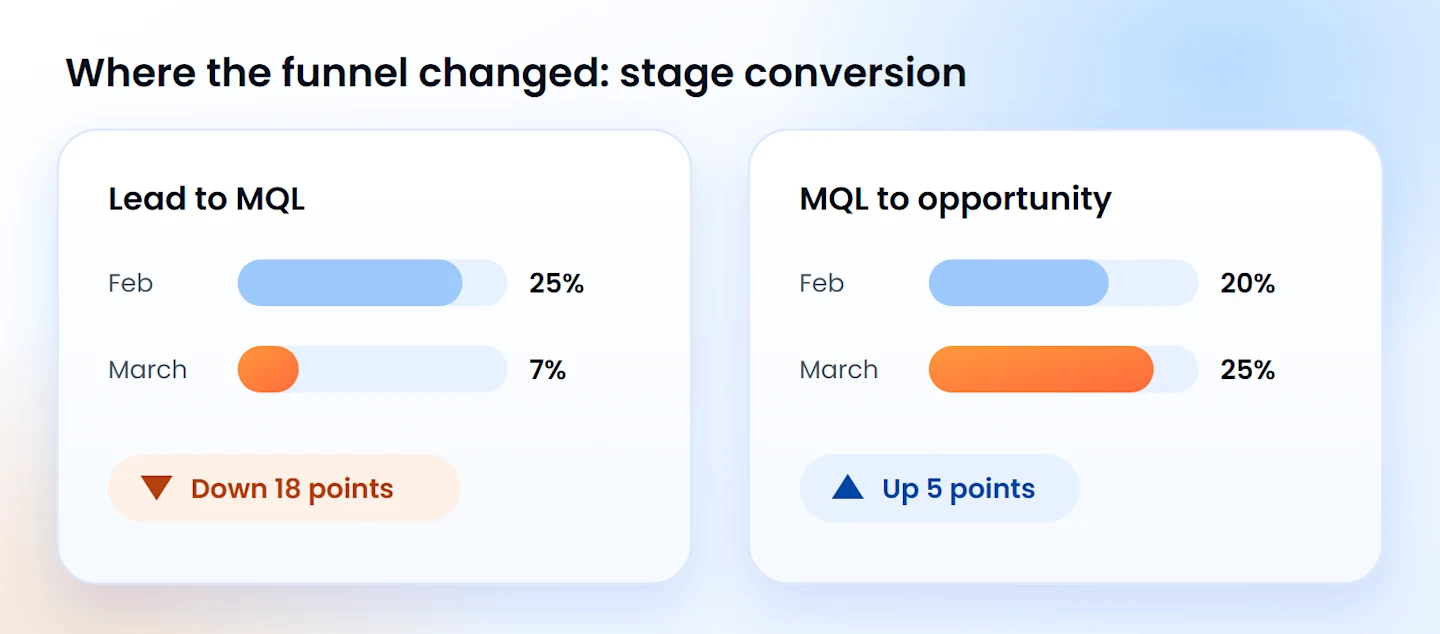
The chart shows the conversion rate at each stage. Lead to MQL conversion fell from 25.0% to 6.8%. MQL to opportunity conversion moved from 20.0% to 25.0%, so the leads that did qualify moved forward as before. Fewer leads qualified, so cost per MQL rose from $310 to $1,150 and pipeline fell from $23,250 to $8,000.
This points you to the lead-to-MQL stage. It does not tell you why the change happened. The cause could be lead quality, a change in qualification rules, tracking or targeting, and the files alone can't say which.
Follow-up questions help you narrow it down:
"Split this campaign by audience. Did one audience stop qualifying?"
"Did the qualification rule change in March?"
"Show lead to MQL conversion for every campaign. Did others drop too?"
Each answer comes with its steps, so you can see how the agent got there.
Want this investigation run on your own funnel data?
Tell us which metric moved, and we'll show you how the agent would approach it.How does the agent narrow down why cost per MQL jumped?
The agent splits cost per MQL into two parts, then compares the campaign with the others. Cost per MQL equals cost per lead divided by the MQL rate, so a jump has to come from one of those two numbers.
driver | Feb | March | change |
|---|---|---|---|
Spend | $9,300 | $9,200 | -1.1% |
Leads | 120 | 118 | -1.7% |
Cost per lead | $77.50 | $77.97 | +0.6% |
MQL rate | 25.0% | 6.8% | -73% |
Cost per MQL | $310 | $1,150 | +271% |
Cost per lead barely moved, so the price of acquiring leads did not cause the jump. The MQL rate fell to about a quarter of its February level, and that fall explains almost all of the change.
Next, the agent checks whether the drop is specific to this campaign. It compares the MQL rate for all six campaigns:
campaign | Feb MQL rate | March MQL rate | change |
|---|---|---|---|
Social Prospecting | 25.0% | 6.8% | -18.2 points |
Paid Search | 24.8% | 25.0% | +0.2 points |
Webinar Series | 35.0% | 35.7% | +0.7 points |
Email Nurture | 24.0% | 24.1% | +0.1 points |
Retargeting | 20.0% | 21.0% | +1.0 points |
Partner Referrals | 45.0% | 45.2% | +0.2 points |
Every other campaign stayed within one point. A company-wide change, such as a new MQL scoring rule, would have moved the others too, so that cause looks less likely. The drop points toward something specific to Social Prospecting, such as its audience, its offer or the way that source gets scored.
The agent also flags how little data sits behind the March figures. Only 8 leads became MQLs and only 2 became opportunities. At that size, one or two leads swing the rates a long way, so the MQL to opportunity rate of 25.0% tells you little. Treat the lead to MQL drop as the signal.
The files can't say which cause applies. Late scoring is one more possibility: if March leads have not been scored yet, the rate looks low until the scores arrive. Ask the owner of the lead source for March lead-level detail, then bring it back to the agent. Before you act on any finding like this, check the agent's work.
How do you check an AI agent's work?
You check an agent's work by confirming the matches, reconciling the totals and recalculating a result by hand.
A recorded workflow makes errors easy to find, because every step is open to review. These five checks work on any agent-built workflow:
Confirm the matches. Read the agent's note on matched names and check each pair. A wrong match merges two different campaigns.
Reconcile the totals. Add the source rows and compare them with the combined table, then read any written summary against that table. In the example, February and March spend add up to $18,500 in both places.
Recalculate one KPI by hand. Divide $9,300 by 30 MQLs. You get $310, the same figure the agent reports.
Check the definitions. Confirm that "MQL" in the leads file follows the rule your team uses.
Test a follow-up. Ask the agent to split the campaign by audience. If the parts add up to the whole, the workflow holds together.
Run the checks the first time, and again whenever the data or the definitions change.
Planning to test an agent on your own data?
Tell us which files you would use, and we'll talk through how to run the checks.
What can go wrong with AI agents for data analysis?
The common problems are names that don't match, conflicting definitions, duplicate rows, missing periods and claims about causes that the data can't support.
Each problem has a simple check:
Names that don't match. A fourth file might write the campaign as "Social-Prospecting" and slip past the match. Review the match list whenever you add a source.
Conflicting definitions. If sales counts an MQL differently from marketing, the KPIs change. Write down one definition before you run the workflow.
Duplicate rows. A lead that appears twice counts twice. If 20 March leads appeared twice, leads would read 138 instead of 118, and the MQL rate would fall from 6.8% to 5.8%. Compare the row counts before and after the combine step.
Missing periods. If a file has no March rows, the agent can't calculate cost per MQL for March. Look for gaps in each source.
Claims about causes. An agent can show where a metric changed. It can't prove why. Treat the finding as a lead and test it.
When should you use an AI agent instead of a dashboard or a spreadsheet?
Use an AI agent for data analysis when a question needs several files, comes up again and again and has a clear metric behind it. Use a dashboard when the question and the data stay the same.
The example above shows the difference. The campaign question needs three files, and it changes each month. A dashboard built for one fixed view can't follow that, and a spreadsheet makes you redo the matching by hand. Several approaches compete for this work, and each suits a different job:
approach | best for | where it falls short |
|---|---|---|
AI agent | Questions that span several files and change each time | You still review the matches, definitions and totals before you rely on a result |
Dashboard | Fixed metrics you watch over time | It can't follow a new question without a rebuild |
Spreadsheet | A small, one-off analysis on one file | Matching and combining several files by hand takes time and invites errors |
BI copilot or text-to-SQL | Plain-language questions on data that is already modeled | It doesn't prepare messy files from several sources |
Custom scripts or notebooks | Full control over every step | Someone with the right skills has to write and maintain them |
You can use them together. An agent investigates a change, and a dashboard keeps tracking the metric afterward.
How do you reuse the workflow next month?
You reuse the workflow by running the same steps on next month's files. Add April's spend, leads and opportunities files, and the agent repeats the match, combine and calculate steps. You get a new table without rebuilding anything.
The first run takes the most attention, because you review the matches and the definitions. After that, each run starts from a workflow you have already checked. That is where the time savings build up: the same question, asked every month, costs you a review and not a rebuild.
You can also change what you ask. Add a new campaign and the agent matches its name and includes it. Ask for pipeline by channel instead, and the agent builds on the same combined data. When a file changes shape, such as a new column or a renamed campaign, review the matches again before you trust the new table. Because the steps stay visible, you can check each new run the same way you checked the first.
How do you score AI agents for data analysis on your own files?
You evaluate an agent by giving it your own files and a question you can already answer, then scoring it on the same criteria as every other candidate. Your data sources and metrics come first, because they decide what a fair test looks like. This section covers the hands-on test. Our guide to agentic analytics covers the wider questions about sources, metrics, security and cost.
A demo on clean sample data shows little. Pick one question your analysts answered recently, collect the files behind it and keep the analyst's result as the answer key. Then test each criterion below:
criterion | what to test | what a good result looks like |
|---|---|---|
Data sources | Load files from every system the question needs | Each source loads without manual reshaping, and the agent reports what it read |
Matching | Include names that differ across files, such as snake_case and Title Case | The agent finds the matches, lists them and joins the rows one to one |
KPI accuracy | Recalculate three KPIs by hand | Every figure matches your answer key |
Definitions | Check how the agent treats MQL, revenue or any term your teams define | It uses your definition and says when a file doesn't define a term |
Transparency | Open the steps behind one result | You can retrace each step from the source rows to the final figure |
Follow-ups | Ask one drill-down question and one comparison question | The answers agree with the first result, and the parts add up to the whole |
Repeatability | Run the next period's files | The same steps run on new data, and you review changes instead of rebuilding |
Limits | Ask a "why" question the files can't answer | The agent says what the data can't prove |
Security and access | Ask who can see the data, where it is processed and what is recorded | The answers fit your security policies, and your security team reviews them in writing |
Cost and effort | Time your reviewers and ask for the pricing model | You can estimate cost at your volume, including review time |
Score each row from 0 to 3 for every candidate. Weight the rows by what matters to you. Accuracy and transparency usually carry the most weight, because a fast wrong answer costs more than a slow right one. The scores give you a shortlist, and a pilot on your own data confirms it.
How do you test an AI agent for data analysis in a pilot?
You run a pilot in six stages, from one scoped question to a rollout decision. Each stage ends with a test, so you know when to move on.
Scope one question. Pick a question with a clear metric, two or three sources and an owner. Write the KPI definitions down. Exit test: the owner agrees the definitions.
Set the answer key. Have an analyst answer the question by hand. Record the figures and the time it took. Exit test: two people agree on the figures.
Run the agent. Give it the same files and the same question. Compare every figure with the answer key. Exit test: all figures match, or you can explain each difference.
Break the data on purpose. Rename a campaign in one file, duplicate a few rows, drop a month and change a column name. Exit test: the agent catches or reports each problem, or you know which checks to add.
Review security and access. Share the data flow with your security and data owners. Cover who can run the agent, which sources it reaches and what gets recorded. Exit test: security signs off in writing or lists the changes it needs.
Decide and plan the rollout. Score the agent with the table above. If it passes, start with one team, name a reviewer and rerun the pilot question each month. Exit test: a named owner, a review routine and a date for the next review.
The pilot gives you evidence from your own data, which a vendor demo can't. It also gives your analysts, your security team and your leaders the same set of results to discuss.
Want help scoping a pilot?
Tell us the question and the sources, and we'll walk through how to test it.
Try it with one question
AI agents for data analysis save the most time on the step before the answer: matching and combining files. Start with one question that spans two or three of your files, and check the agent's steps against your source data.