The Automated, No-Code Data Stack
Learn how Astera Data Stack can simplify and streamline your enterprise’s data management.

Data Science vs. Data Analytics: Key Differences
Data Science vs. Data Analytics
Organizations increasingly use data to gain a competitive edge. Two key disciplines have emerged at the forefront of this approach: data science and data analytics.
While both fields help you extract insights from data, data analytics focuses more on analyzing historical data to guide decisions in the present. In contrast, data science enables you to create data-driven algorithms to forecast future outcomes.
These disciplines differ significantly in their methodologies, tools, and outcomes. Understanding these differences is vital not only for data professionals but anyone working with data.
What Is Data Science?
Data science is the study of data that combines analytics, mathematics, and statistics to extract useful insights and guide business decisions. Being an interdisciplinary field, it involves collaboration between multiple stakeholders:
- Domain experts
- Data engineers to manage data infrastructure
- Machine learning (ML) specialists to develop predictive models
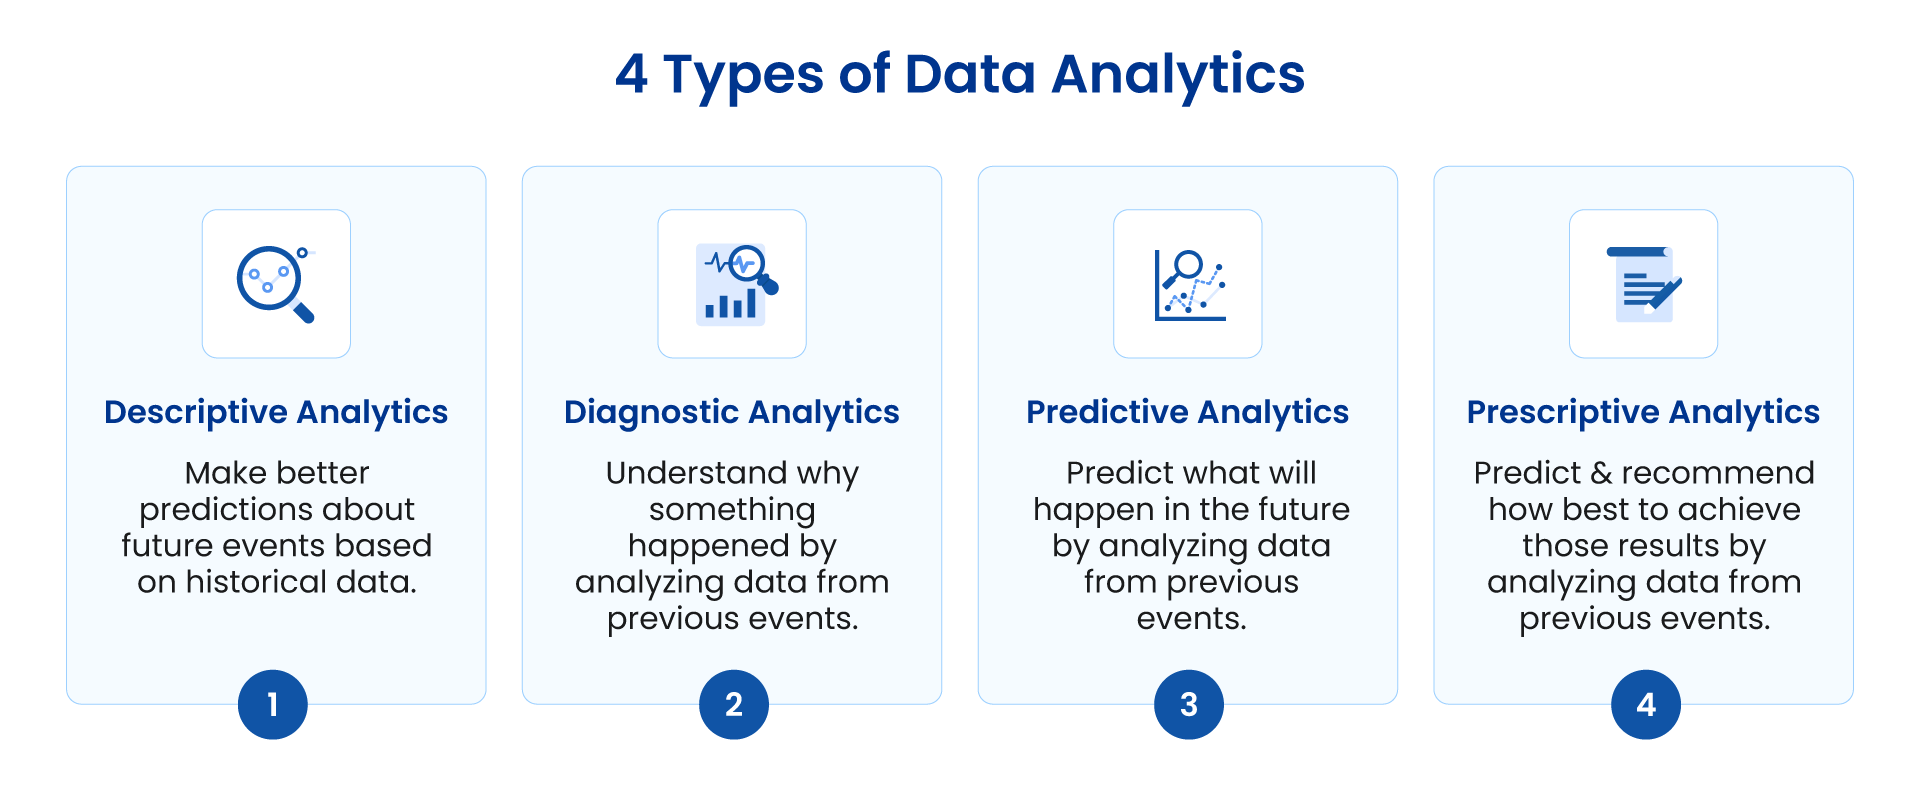
The goal is to provide insights that are not only descriptive (explaining what has happened) but also predictive (forecasting what might happen) and prescriptive (recommending actions to take) in nature.
Data science covers the complete data lifecycle: from collection and cleaning to analysis and visualization. Data scientists use various tools and methods, such as machine learning, predictive modeling, and deep learning, to reveal concealed patterns and make predictions based on data. Here are the critical components of data science:
- Data Collection: Accumulating data from diverse sources like databases, APIs, and web scraping.
- Data Cleaning and Preprocessing: Ensuring data quality by managing missing values, eliminating duplicates, normalizing data, and preparing it for analysis.
- Exploratory Data Analysis (EDA): Leveraging statistical techniques and visualization tools to comprehend data distributions and relationships.
- Model Building: Creating and training machine learning models to predict outcomes and classify data.
- Evaluation and Optimization: Assessing model performance using accuracy, precision, and recall metrics and refining models for improved accuracy.
- Deployment: Implementing models in production environments to make real-time predictions and automate decision-making.
What Is Data Analytics?
While data analytics is part of data science, it examines historical data to uncover trends, patterns, and insights. It helps you systematically leverage statistical and quantitative techniques to process data and make informed decisions.
The primary goal of data analytics is to analyze historical data to answer specific business questions, identify patterns, trends, and insights, and help businesses make informed decisions.
For example, an analytics goal could be to understand the factors affecting customer churn or to optimize marketing campaigns for higher conversion rates.
Analysts use data analytics to create detailed reports and dashboards that help businesses monitor key performance indicators (KPIs) and make data-driven decisions. Data analytics is typically more straightforward and less complex than data science, as it does not involve advanced machine learning algorithms or model building.
Data Science vs. Data Analytics: Key Differences
Both data science and analytics involve working with data and can be used to predict future outcomes. However, the critical difference lies in the scope and depth of their approaches.
Data Analytics is generally more focused and tends to answer specific questions based on past data. It’s about parsing data sets to provide actionable insights to help businesses make informed decisions. While it can involve predictive analytics to forecast future trends, its primary goal is to understand what happened and why.
On the other hand, Data Science is a broader field that includes data analytics and other techniques like machine learning, artificial intelligence (AI), and deep learning. Data scientists often work on more complex problems and use advanced algorithms and models to predict future events and automate decision-making, which leads to new data-driven products and features.
In other words, while data analytics can provide insights and inform decisions, data science uses data to manufacture systems that can understand data and make decisions or predictions. It’s like the difference between understanding the data and creating new ways to interact with it. Both are valuable but serve different purposes and require different skill sets.
| Data Science | Data Analytics | |
| Scope and Objectives | Broad and exploratory. It seeks to discover new insights and build predictive models to forecast future trends. | Narrow and specific. It focuses on answering predefined questions and analyzing historical data to inform decision-making. |
| Methodologies | Uses advanced AI and ML algorithms and statistical models to analyze structured and unstructured data. | Employs statistical methods and data visualization techniques, primarily working with structured data. |
| Outcomes | Produces predictive models and algorithms that can automate decision-making processes and uncover hidden patterns. | Generates reports and dashboards that summarize past performance and provide actionable insights for business strategies. |
Data Science vs. Data Analytics: Differences in the Process
The processes involved in data science and analytics also differ, reflecting their distinct goals and methodologies.

Data Science Process
- Business Objective: This is where you start. It would help if you grasped what the customer wants to achieve fully. You define the business objectives, assess the situation, determine the data science goals, and plan the project. It’s all about laying a solid foundation for your project.
- Data Collection and Integration: In this step, you must gather large data sets from various areas, such as unstructured sources, databases, APIs, and web scraping. Once the data is collected, it undergoes integration. Data integration combines data from many sources into a unified view. It involves data transformation, cleaning, and loading to convert the raw data into a proper state. The integrated data is then stored in a Data Warehouse or a Data Lake. These storage systems are important in data analytics and data science, providing the necessary infrastructure for storing and processing large amounts of data.
- Data Cleaning and Preparation: Data cleaning and preparation involves preprocessing the data to make it suitable for analysis. It includes handling missing values, which could be filled using various imputation methods, and dealing with outliers, which could skew the results. The data is also transformed into a suitable format for analysis, such as normalizing numerical data or encoding categorical data.
- Exploratory Data Analysis (EDA): EDA is all about uncovering initial insights. It involves visualizing the data using plots and charts to identify patterns, trends, and relationships between variables. Summary statistics are also calculated to provide a quantitative description of the data.
- Model Building: This step uses machine learning algorithms to create predictive models. The choice of algorithm depends on the nature of the data and the problem at hand. Data teams split this data into two sets: training and testing sets. They train the model on the training set.
- Model Evaluation: After they build the model, teams assess its performance using metrics like accuracy, precision, and recall. These metrics provide insight into how well the model performs in correctly predicting the outcomes.
- Deployment: Finally, you’re ready to share your findings. Once the model is evaluated and fine-tuned, it is implemented in a real-world environment for automated decision-making. You must plan the deployment, monitor and maintain the model, produce the final report, and review the project.
- Monitoring and Maintenance: Teams continuously track the model’s performance after deployment to ensure it remains effective over time. If the model’s performance declines, they may need to adjust or retrain it with new data. This step is vital in ensuring the model stays relevant as new data comes in.
Data Analytics Process
- Goal Setting: The first step in any analytics project is establishing clear and measurable goals with the stakeholders. These goals should align with the overall business goals and should be specific, measurable, achievable, relevant, and time-bound. The stakeholders could be anyone from executives and managers to end-users who have a vested interest in the outcome of the analytics project.
- Data Collection and Integration: In this step, you must gather data from various sources such as databases, data warehouses, data lakes, online services, and user forms. Data warehouses and data lakes play a key role here. They store large amounts of structured and unstructured data, respectively, and provide a central repository for data that’s been cleaned, integrated, and ready for analysis.
- Data Cleaning: Data cleaning allows you to ensure the quality of the data by correcting errors, dealing with missing values, and standardizing formats. Tools like SQL for structured data and Hadoop or Spark for big data can be used in this process. It’s all about ensuring the data is reliable and ready for analysis.
- Data Analysis: Now, it’s time to explore the data and discover patterns and trends. Using statistical techniques and machine learning algorithms, we aim to understand the data and predict future outcomes. This stage often requires tools like R and Python and libraries like Pandas, NumPy, and Scikit-learn.
- Data Visualization: This is where you create visual representations of the data to help understand the patterns and trends. Tools like Tableau, PowerBI, or libraries like Matplotlib and Seaborn in Python, help in creating effective visualizations.
- Data Reporting: Finally, you must summarize your findings in reports and dashboards, ensuring they’re easy to understand and answer the business questions that started the process. Reporting tools like Tableau and PowerBI allow you to create interactive dashboards that decision-makers can use to get the necessary insights.
Skills Required for Data Science vs. Data Analytics
The skills required for data science and analytics reflect their different focuses and methodologies.
Skills Required for Data Science
- Programming: You’ll need proficiency in Python, R, and Java. This skill is essential for writing scripts to process, analyze, and visualize data.
- Machine Learning: Understanding algorithms and frameworks like scikit-learn, TensorFlow, and PyTorch are crucial. These allow you to create predictive models and extract patterns from complex data sets.
- Statistics and Mathematics: A strong foundation in statistical methods, probability, and linear algebra is key. These are the building blocks for machine learning algorithms and statistical analysis.
- Data Manipulation: Experience with data processing tools like Pandas and NumPy is important. These tools enable you to clean, transform, and prepare data for analysis.
- Big Data Technologies: Knowledge of Hadoop, Spark, and other big data frameworks is beneficial. It lets you handle and analyze large data sets common in today’s data-rich environments.
- Domain Expertise: It is vital to understand and apply data science concepts to specific industry problems. This helps you provide meaningful insights and solutions that are relevant to the business.
Skills Required for Data Analytics
- SQL: Proficiency in querying and managing relational databases is a must. It allows you to retrieve and manipulate data efficiently.
- Data Visualization: Expertise in tools like Tableau, Power BI, and D3.js is important. It helps you to present data in a visually appealing and understandable way.
- Statistical Analysis: Understanding descriptive and inferential statistics is crucial. It lets you summarize data and make inferences about populations based on sample data.
- Excel: Advanced skills in spreadsheet manipulation and analysis are beneficial. Excel is a widely used tool for data analysis and visualization.
- Communication: The ability to present findings clearly to non-technical stakeholders is key. It ensures that your insights can be understood and acted upon by decision-makers.
- Business Acumen: Understanding the business context and converting insights into strategic recommendations is essential. It ensures that your analysis aligns with business goals and adds value.
Data Science vs. Data Analytics: Tools
The tools used in data science and data analytics are tailored to their specific tasks and requirements.
Data Science Tools:
- Programming Languages: Python, R, Java.
- Machine Learning Libraries: TensorFlow, PyTorch, scikit-learn.
- Data Processing: Pandas, NumPy.
- Big Data Platforms: Hadoop, Spark.
- Visualization: Matplotlib, Seaborn.
- Integrated Development Environments (IDEs): Jupyter, RStudio.
Data Analytics Tools:
- SQL Databases: MySQL, PostgreSQL, SQL Server.
- Data Visualization: Tableau, Power BI, QlikView.
- Statistical Software: Excel, SAS, SPSS.
- BI Tools: Looker, Domo.
- Scripting Languages: Python for scripting and automation.
- Reporting: Microsoft Excel, Google Data Studio.
Data Science vs. Data Analytics: The Use Cases
Both data science and analytics have broad applications, but their use cases vary in scope and complexity.
Data Science Use Cases:
- Predictive Maintenance: Machine failures can cause significant downtime and financial losses in industries like manufacturing or aviation. With data science, companies can use machine learning to process sensor data and predict when a machine might fail. This process involves analyzing past failures and predicting future ones based on complex real-time sensor data patterns.
- Fraud Detection: Financial fraud is often complex and evolves quickly, making it difficult to detect with rule-based systems. However, with machine learning, data scientists can identify unusual patterns that may indicate fraud. This detection goes beyond traditional data analytics, which might only flag transactions based on predefined rules or thresholds.
- Recommendation Systems: Companies like Netflix and Amazon recommend products or movies based on user preferences, even if similar items have never been purchased or watched. Techniques, such as filtering or deep learning, predict preferences based on patterns in the data. In contrast, data analytics might only segment users based on past behavior, which is less effective for personalization.
- Natural Language Processing (NLP): Applications like voice assistants or chatbots need to understand and respond to human language naturally. Data scientists use ML and deep learning to grasp the semantics and context of language, which traditional data analytics cannot achieve.
- Image Recognition: In fields like healthcare and autonomous vehicles, recognizing images—such as identifying diseases in medical imaging or recognizing objects on the road—is essential. Advanced data science methods, such as convolutional neural networks, can identify patterns within image data. This capability is something that data analytics, which usually deals with structured numerical or categorical data, is not equipped to do.
- Sentiment Analysis: Understanding customer sentiment involves analyzing unstructured data like customer reviews or comments under social media posts. Data scientists use NLP and machine learning to discern the sentiment behind text data, which is beyond the capabilities of traditional data analytics.
Data Analytics Use Cases:
- Sales Trend Analysis: Data analytics enables retail businesses to dissect historical sales data, revealing patterns and trends. This insight allows them to identify popular products, peak seasons, and potential areas for sales growth, shaping their inventory decisions.
- Customer Segmentation: Companies can delve into customer data through data analytics, identifying shared characteristics such as purchasing behavior or demographics. Data analytics is used to process customer data, applying clustering algorithms to group customers based on shared characteristics. This segmentation informs targeted marketing strategies. It helps you create more personalized marketing campaigns, improve customer retention, and increase sales.
- Supply Chain Optimization: Data analytics can help you scrutinize inventory levels, supplier performance, and delivery times. Statistical analysis can help identify bottlenecks and provide a roadmap for process improvements.
- Risk Management: Data analytics examines historical market trends and investment performance data in the financial sector. This analysis aids in risk assessment and informs decisions about resource allocation and future investment strategies.
- Healthcare Analytics: In healthcare, data analytics tracks patient outcomes and identifies risk factors for different conditions. This analysis supports healthcare providers in making data-driven decisions about treatment plans.
- Website Analytics: Data analytics is crucial for understanding user interactions with websites. It processes data on user interactions with websites, which involves statistical analysis and possibly A/B testing. The results can include improved user experience, increased conversion rates, and more effective website design. Businesses can improve their website by analyzing page views, bounce rates, and engagement rates.
Final Word
Data science and data analytics are both vital in extracting insights from data. Each field has unique objectives, processes, skills, tools, and use cases. As we navigate through the complexities of data science vs. data analytics, it becomes clear that a robust data management solution is the foundation for building data pipelines that enable seamless data flow for both data science and data analytics tasks.
This is where Astera steps in. Astera’s data management platform is designed to enable both data science and analytics by offering comprehensive features that streamline data workflows, from data integration to data warehousing.
Astera’s Key Features:
- Data Pipeline: Simplify complex data workflows with intuitive drag-and-drop actions and automate data management processes with Astera’s high-performing data pipelines. Spend less time on data logistics and more on deriving valuable insights.
- Data Warehousing: Accelerate your data warehouse tasks with Astera’s user-friendly and no-code UI. Centralize high-quality data for streamlined analysis.
- Scalability: Adapt to your growing data requirements with Astera’s scalable solutions. Handle increasing data volumes efficiently without compromising performance, ensuring your analytics can keep up with expanding data sets.
- Comprehensive Data Integration: Combine data from various sources, including databases, cloud platforms, and web applications, using Astera’s extensive range of native connectors and REST APIs to ensure a comprehensive view of your data landscape.
- Efficient Data Modeling: Construct logical schemas for data warehouses effortlessly by importing or reverse-engineering database schemas into widely used data modeling patterns like 3NF, dimensional modeling, and data vault. Enhance your data architecture with minimal effort.
- Versatile Data Transformations: Modify your data using Astera’s library of transformations, a key feature for data analysts working on data cleaning and preprocessing.
- Dynamic Reporting and Analysis: Retrieve and analyze data from marts and warehouses using OData queries and seamlessly integrate it into leading BI tools like Power BI and Tableau. Create dynamic, insightful reports that drive data-driven decisions.
Astera’s advanced features empower data science and analytics experts to effectively manage, analyze, and derive actionable insights from their data, making it an indispensable tool in your analytical toolkit.
Leverage Astera’s powerful data management tools to unlock your data science and analytics initiatives’ full potential.
Get Started Now!
- Start Your Free Trial: Dive into Astera’s features and transform your data processes today.
- Contact Us: Connect with our team for a tailored demonstration.
Authors:
Fasih Khan


 Nov 11th