The Automated, No-Code Data Stack
Learn how Astera Data Stack can simplify and streamline your enterprise’s data management.

What is Data Observability? A Complete Guide
What is Data Observability?
Data observability is a process that actively monitors an organization’s data for accuracy, health, and usefulness. It is the ability of an organization to have comprehensive visibility over its entire data landscape, including data pipelines, infrastructure, and applications. Data observability allows the organization to quickly identify, control, prevent, remediate, and fix data outages, all within agreed service level agreements (SLAs).
With data observability, organizations gain a deeper understanding of their data’s health by enabling them to monitor different metrics. For example, data volume to keep a check on any sudden surges or drops in data, error rates to ascertain data quality issues, and latency to ensure data remains accessible. Based on these signals or metrics, organizations gain insights that improve data management and governance, which means better business decisions.
The Origins of Data Observability
In the mid-1800s, Scottish physicist James Clerk Maxwell encountered the challenge of monitoring complex systems. He recognized the impossibility of directly observing every piece of information within such systems. Maxwell’s solution involved focusing on critical outputs and drawing inferences about the system’s overall health based on these observations. This pioneering work laid the groundwork for the concept of observability.
The need for a deep understanding of data health and integrity throughout its lifecycle sparked the rise of data observability as an important field in data management.
Data Observability vs. Data Quality
| Data Observability | Data Quality | |
| Objective | Provide real-time visibility into data pipelines and their health. | Ensure data adheres to predefined standards for accuracy, completeness, consistency, and validity. |
| Focus | System behavior and data flow. | Intrinsic characteristics of the data itself. |
| Impact | Proactive identification and resolution of data issues, promoting trust in data-driven decisions. | Improved data reliability and fitness for intended use. |
| Scope | Encompasses the entire data lifecycle, from data ingestion to transformation and delivery. | Primarily focuses on the data itself at a specific point in time. |
| Usage | Monitors data pipelines for anomalies, latency, schema changes, and data lineage. | Validates and cleanses data to meet specific business rules and data governance requirements. |
| Application | Alerts data teams to potential issues before they impact downstream processes. | Ensures data is accurate and reliable for reporting, analytics, and machine learning models. |
The Importance of Data Observability
The exponential growth of data in modern organizations highlights the importance of maintaining data quality and reliability for informed decision-making. Data observability is a solution that empowers organizations to effectively manage their complex data infrastructures and ensure the integrity of their insights.
Traditional data quality checks offer a limited view as they focus on data at a specific point in time. Data observability, however, provides a deep understanding of the data lifecycle. It involves continuously monitoring key metrics throughout data pipelines, giving organizations real-time or near real-time insights into their data systems’ health and behavior. These insights are important to prevent the effects of poor data quality, like distorted reports and skewed analytics.
Being a proactive measure, data observability lets data teams actively spot and fix anomalies, latency, schema changes, or lineage problems before they impact insights.
In machine learning, ignoring data observability can lead to a progressive decline in the model’s performance. For example, ML models are prone to data drift without proper data observability and can become ineffective over time.
Data observability helps detect these drifts, ensuring models remain reliable. Moreover, the complexity and volume of modern data pipelines present challenges in maintaining data quality and clear data lineage. Data observability equips teams with the necessary tools to solve these challenges by providing real-time insights into the data architecture. It ensures a smooth data flow, reducing disruptions and speeding up the delivery of valuable insights.
5 Pillars of Data Observability
Data observability’s effectiveness relies on several key pillars. These pillars are a framework that provides monitoring and analysis of information used throughout the organization.
Freshness
Freshness refers to how up-to-date a data set is. The primary focus of this pillar is the timeliness of data within the pipelines. Organizations need to define acceptable latency thresholds for data updates. Monitoring metrics like data age, update frequency, and timestamps help identify delays or disruptions in data ingestion or transformation processes. Fresh data ensures insights are based on the latest information, leading to more informed decision-making.
Distribution
Data observability helps monitor key statistical properties like mean, median, and standard deviation. It also helps identify underlying issues with the source data itself. Timely identification of deviations from expected data distribution patterns allows data teams to investigate and resolve these issues before they distort analytical outcomes.
Volume
Unexpected increases or decreases in data volume can indicate potential issues like data source problems, pipeline bottlenecks, or data quality deterioration. With data observability, teams can monitor fluctuations in data volumes, allowing them to get to the root cause and streamline data flow.
Schema
Data schema shows the structure and organization of data within pipelines. Organizations can continuously monitor the schema changes, including additions, deletions, or modifications to data fields with data observability. Schema monitoring enables data teams to identify potential schema drifts that could disrupt downstream processes or introduce inconsistencies in data analysis.
Lineage
Data lineage tracks the origin, transformation steps, and destination of data within pipelines. If a data quality issue is identified, data lineage allows teams to trace it back to its source and pinpoint the affected downstream processes. Data observability focuses on mapping data lineage that facilitates the root cause analysis and efficiently addresses the data quality issues.
Key Components and Features of Data Observability
Data Monitoring
Data pipelines are complex networks that transport information and must be monitored. Data observability equips organizations with metrics that offer a comprehensive view of data flow throughout the pipeline.
Alerting Systems
Data observability leverages alerting systems to notify data teams of any anomalies or issues detected within pipelines. These alerts are triggered by deviations from pre-defined thresholds for various metrics, allowing teams to address potential problems before they escalate.
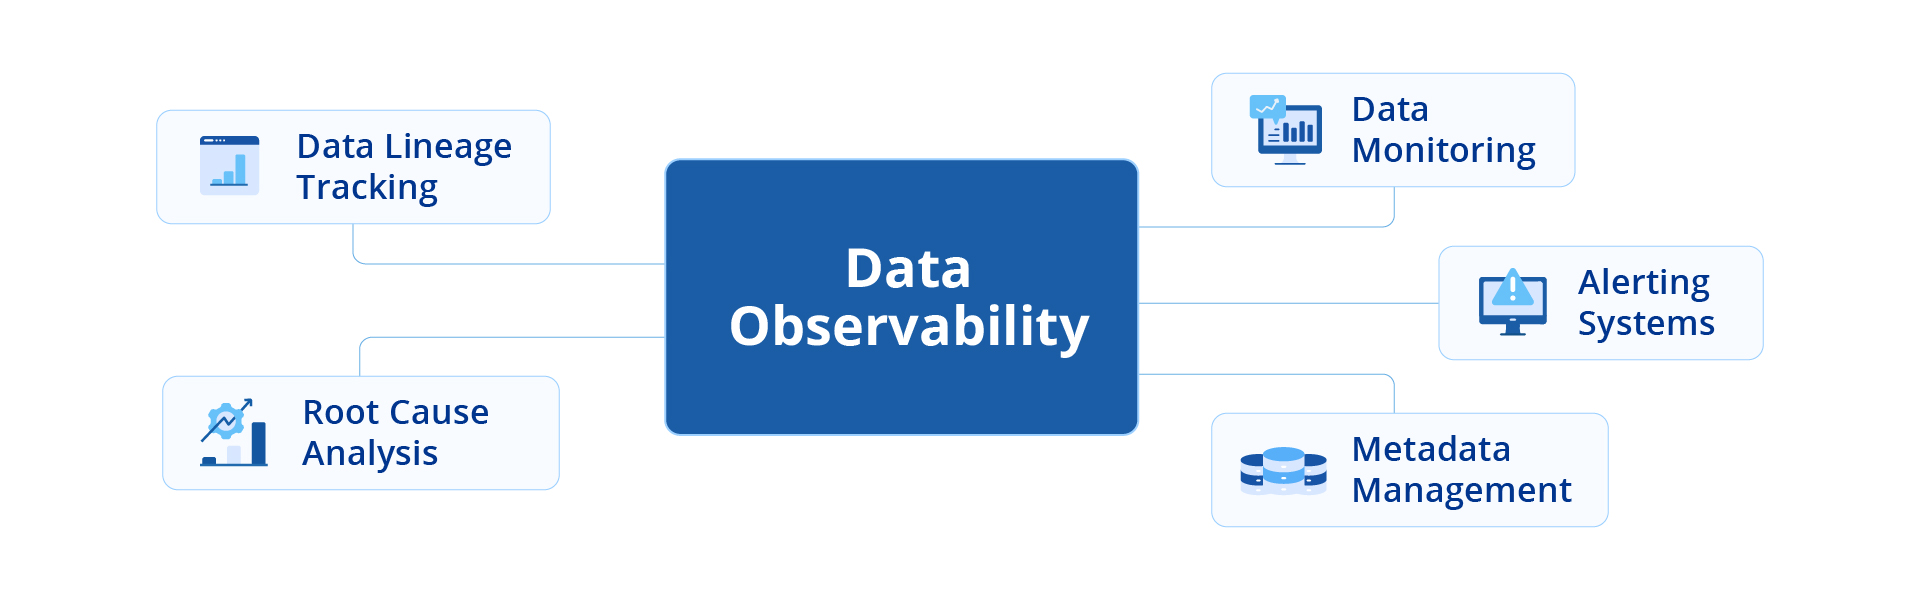
Metadata Management
Effective data observability relies on organized and readily accessible metadata, that defines details like data schema, lineage, and ownership, providing context. Metadata management ensures the information remains up-to-date and readily available, empowering data teams to understand the meaning and origin of data flowing through pipelines facilitating efficient troubleshooting and impact analysis.
Data Lineage Tracking
Data lineage visually represents the transformations and movements that data undergoes within pipelines. It empowers teams to trace data back to its source, identify potential issues, and ensure data quality remains consistent throughout its lifecycle.
Root Cause Analysis
Root cause analysis empowers data teams to address issues efficiently and prevent them from recurring in the future. Data observability enables data teams to leverage insights from data monitoring, alerts, and lineage tracking to pinpoint the source of data quality problems.
How to Implement Data Observability
Step 1: Inventory Data Use Cases
Successful data observability initiative involves understanding how data is used across the organization. The preliminary step includes identifying the departments or teams that rely on data, the specific types of data they utilize, and the intended purpose of each data set. By understanding these use cases, organizations can prioritize data observability efforts based on the potential impact on business functions.
Step 2: Align the Organization
Implementing data observability requires collaboration across various teams within an organization. Communicate the importance of data observability to all stakeholders, emphasizing how it benefits various departments and ultimately strengthens data-driven decision-making. Communication creates a culture of data ownership and invests in the success of the implementation.
Step 3: Implement Data Quality Monitoring
This stage involves implementing tools to monitor various data quality metrics. These metrics include data freshness, completeness, accuracy, and consistency. Monitoring these metrics can give organizations an understanding of overall data health and identify potential areas for improvement.
Step 4: Optimize Data Quality
To optimize data quality, teams should have clearly defined steps for what to do when a problem arises. Also, assign ownership for different incidents and implement tools to streamline troubleshooting and root cause analysis. Organizations can reduce the potential impact on downstream processes and decision-making by optimizing incident resolution processes.
Step 5: Risk Prevention
This final step focuses on implementing strategies to prevent data quality incidents from occurring in the first place. This step involves data validation rules at data ingestion points, data lineage tracking to identify potential issues early in the data pipeline, and automation of data quality checks throughout the data lifecycle. Organizations can minimize data quality issues and ensure the trustworthiness of their data by prioritizing preventative measures.
Benefits of Implementing Data Observability
A well-designed data observability strategy delivers a range of benefits.
-
Boosts Data Quality
With cleaner data, organizations can make better data-driven decisions, leading to improved operations, happier customers, and stronger overall business performance. Data observability empowers teams to identify issues as soon as they occur, like missing values, duplicate records, or inconsistent formats, before they disrupt dependent workflows.
-
Fast-Tracks Troubleshooting
Data observability tools help teams quickly identify errors or data deviations. Features like real-time monitoring, anomaly detection, and alerts enable faster troubleshooting and issue resolution, minimizing downtime costs and severity.
-
Helps Break Down Silos
Data observability platforms offer shared dashboards that give various stakeholders visibility into critical data sets and foster better team collaboration and communication.
-
Optimizes Efficiency
Data observability tools pinpoint bottlenecks and performance issues, allowing engineers to optimize systems for better resource usage and faster processing times. Additionally, automation reduces manual effort in maintaining data health, freeing up data engineers to focus on extracting value from the data.
-
Strengthens Compliance
Data observability helps ensure data meets accuracy, consistency, and security standards in regulated industries like finance, healthcare, and telecommunications. This reduces the risk of non-compliance and related penalties.
-
Enhances Customer Experience
High-quality data is important to understand customer needs, preferences, and behaviors. Data observability helps maintain accurate and up-to-date customer data, improving customer satisfaction and loyalty through personalized experiences.
-
Drives Revenue Growth
Data observability offers new insights, identifies trends, and uncovers potential revenue opportunities by keeping data health in check. Organizations can use their data more effectively, leading to increased revenue and growth.
Challenges of Data Observability
Complex Infrastructure
The heterogeneity of technologies, distributed systems, and decentralized management make achieving consistent data collection and holistic visibility difficult. Standardizing metrics and leveraging a central observability platform can help.
Data Volume
The complexity of systems often causes data volume to increase. As systems and applications produce more data, observability tools can get overwhelmed, limiting their ability to analyze and offer insights. This can lead to increased latency, which can impair effective observability. Therefore, scaling these tools is important to ensure they don’t miss relevant signals amidst the data flood.
Data Silos
The inability to correlate data from different sources makes identifying root causes and trends difficult. It also limits the effectiveness of data observability tools. Breaking down data silos is essential for organizations to gain meaningful insights and enhance data observability.
Cloud Challenges
When moving to the cloud, it’s important to consider how changes in data collection levels might affect data observability, especially since some cloud vendors offer limited options for instrumentation.
Data Observability Best Practices
Defining Data Quality Metrics
Data quality metrics answer essential questions like “How much data is missing?” “How closely does the data reflect reality?” And “are there any discrepancies within similar datasets?” Establishing metrics that answer these questions allows businesses to identify data quality issues, reducing the risk of basing decisions on incorrect or incomplete information.
Simplify Infrastructure Monitoring
Focus on data that provides actionable insights into system health and performance. This practice reduces the burden on observability tools and allows for a more focused analysis.
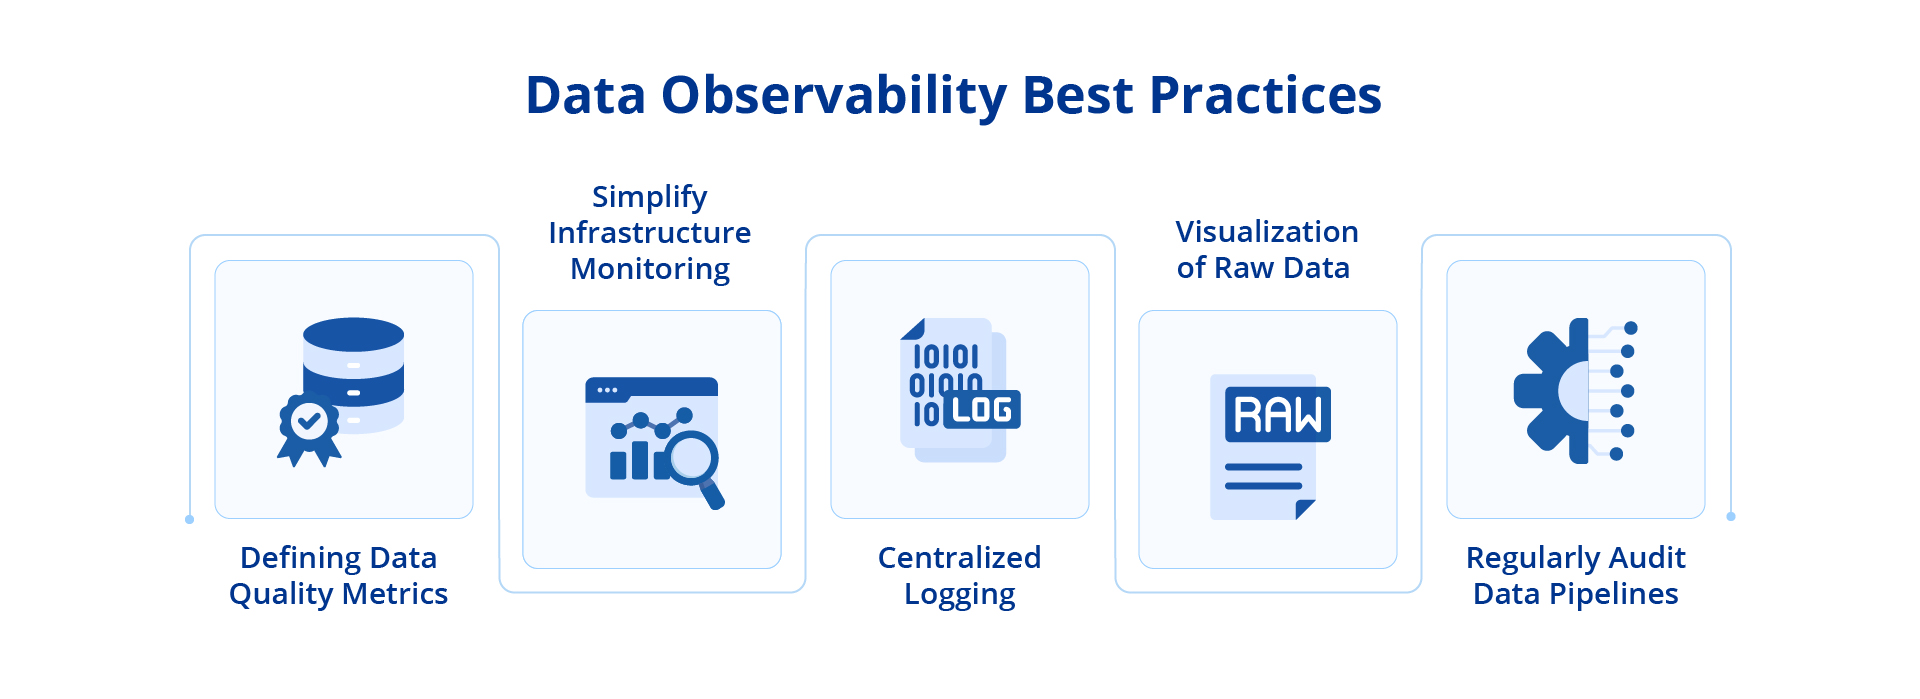
Centralized Logging
Use data observability tools that help to centralize log data from every component in the data infrastructure. The unified view simplifies troubleshooting and root cause analysis of issues. Also, consider tools that provide data lineage tracking, as they help map the data flow through pipelines, making it easier to identify potential issue sources.
Visualization of Raw Data
Transform the raw data into visuals like graphs, charts, and dashboards, as visualization allows for real-time monitoring of key data points or metrics. Clear and concise visualizations make data observability accessible to a broader audience, promoting team collaboration. Stakeholders across departments can easily understand data trends and health, leading to better communication and shared ownership of data quality.
Regularly Audit Data Pipelines
Regular audits allow quicker resolution by identifying bottlenecks early on. These audits ensure smooth data flow throughout the pipeline and guarantee unhindered access to critical data points. Organizations can identify deviations in data quality before they impact the business by focusing on maintaining pipeline health.
How to Choose the Right Data Observability Tool
Data observability tools are essential for gaining deep insights into the organization’s infrastructure. The question of “choosing the right data observability tool” does not have a straightforward answer because not all tools are created equal. Here’s what to consider when selecting the right tool:
- Comprehensive Data Collection: A good observability tool should gather data from various sources across the network, infrastructure, servers, databases, cloud applications, and storage. It should also have features to review, sample, and process this data to provide a holistic view.
- Extensive Visualization: A core function of a good observability tool is to provide a comprehensive data visualization capability. Visualization allows teams to easily understand complex data sets and identify trends or patterns that indicate data quality problems.
- Integration with Existing Architecture: Look for a tool that seamlessly integrates with the existing data architecture and sources. Ideally, it should monitor data at rest (without extraction) and in motion throughout its lifecycle.
- Advanced Features: Look for tools incorporating artificial intelligence for Operations (AIOps) and advanced analytics. These features automate tasks and provide deeper insights, allowing the tool to better support business goals alongside IT needs.
- Ease of Use: The ideal tool should integrate smoothly with the existing workflows and require minimal upfront work. Prioritize tools that don’t require extensive data standardization, mapping, or data pipeline alterations for a smoother implementation experience.
Concluding Thoughts
The true value of data lies in its quality and accessibility. Data observability offers deep insights into an organization’s data infrastructure, ensuring the health and reliability of data pipelines. This focus on data quality, in turn, improves data-driven decision-making while leveraging a company’s data assets.
By implementing a data observability strategy and following best practices, organizations can overcome challenges that arise due to a complex infrastructure, data silos, and ever-growing data volumes.
Not every business needs an advanced data observability platform because data quality management is a strong foundation for healthy data and, if done right, can tackle most data challenges effectively. While data observability offers deep insights, especially in scenarios with complex data pipelines and extremely high volumes of data, teams should prioritize enhancing data quality as it delivers the most direct and significant benefits. Once the foundation is set, businesses can consider data observability as an extra layer of visibility and proactive management.
Astera’s data management solutions easily blend with your existing infrastructure, enabling adequate data ingestion, transformation, and merging from multiple sources without intricate configurations. Astera prioritizes data quality and ensures the reliability and integrity of data pipelines.
Visit our website or schedule a demo and see how Astera can improve your data management practices and enhance the overall visibility of your entire data landscape.
Gain Clarity in Your Data Infrastructure with Astera's Data Management Solutions
Streamline Your Data Processes Today with Astera - Ensure Data Quality, Enhance Visibility, and Drive Informed Decision-Making. Schedule a Demo Now!
Request a Demo
Authors:
Zoha Shakoor